Pandas Tutorial
Pandas (stands for Python Data Analysis) is an open-source software library designed for data manipulation and analysis.
- Revolves around two primary Data structures: Series (1D) and DataFrame (2D)
- Built on top of NumPy, efficiently manages large datasets, offering tools for data cleaning, transformation, and analysis.
- Tools for working with time series data, including date range generation and frequency conversion. For example, we can convert date or time columns into pandas’ datetime type using
pd.to_datetime(), or specifyparse_dates=Trueduring CSV loading. - Seamlessly integrates with other Python libraries like NumPy, Matplotlib, and scikit-learn.
- Provides methods like
.dropna()and.fillna()to handle missing values seamlessly


Important Facts to Know :
- DataFrames: It is a two-dimensional data structure constructed with rows and columns, which is more similar to Excel spreadsheet.
- pandas: This name is derived for the term "panel data" which is econometrics terms of data sets.
What is Pandas Used for?
With pandas, you can perform a wide range of data operations, including
- Reading and writing data from various file formats like CSV, Excel and SQL databases.
- Cleaning and preparing data by handling missing values and filtering entries.
- Merging and joining multiple datasets seamlessly.
- Reshaping data through pivoting and stacking operations.
- Conducting statistical analysis and generating descriptive statistics.
- Visualizing data with integrated plotting capabilities.
Why Learn Pandas
Here’s why it’s worth learning:
- It offers a simple and intuitive way to work with structured data, especially using DataFrames.
- Makes data exploration easy, so you can quickly understand patterns or spot issues.
- Saves time by reducing the need for complex code.
- It's widely used in industries like finance, healthcare, marketing and research.
- A must-have skill for data science, analytics and machine learning roles.
Pandas Basics
In this section, we will explore the fundamentals of Pandas. We will start with an introduction to Pandas, learn how to install it and get familiar with its functionalities. Additionally, we will cover how to use Jupyter Notebook, a popular tool for interactive coding. By the end of this section, we will have a solid understanding of how to set up and start working with Pandas for data analysis.
Pandas DataFrame
A DataFrame is a two-dimensional, size-mutable and potentially heterogeneous tabular data structure with labeled axes (rows and columns).
- Creating a DataFrame
- Pandas Dataframe Index
- Pandas Access DataFrame
- Indexing and Selecting Data with Pandas
- Slicing Pandas Dataframe
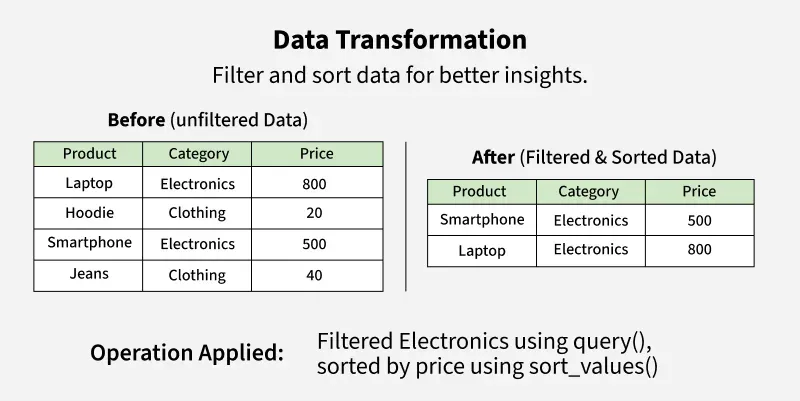
- Filter Pandas Dataframe with multiple conditions
- Merging, Joining and Concatenating Dataframes
- Sorting Pandas DataFrame
- Pivot Table in Pandas
Pandas Series
A Series is a one-dimensional labeled array capable of holding any data type (integers, strings, floating-point numbers, Python objects, etc.). It’s similar to a column in a spreadsheet or a database table.
- Creating a Series
- Accessing elements of a Pandas Series
- Binary Operations on Series
- Pandas Series Index() Methods
- Create a Pandas Series from array
Data Input and Output (I/O)
Pandas offers a variety of functions to read data from and write data to different file formats as given below:
- Read CSV Files with Pandas
- Writing data to CSV Files
- Export Pandas dataframe to a CSV file
- Read JSON Files with Pandas
- Parsing JSON Dataset
- Exporting Pandas DataFrame to JSON File
- Working with Excel Files in Pandas
- Read Text Files with Pandas
- Text File to CSV using Python Pandas
Data Cleaning in Pandas
Data cleaning is an essential step in data preprocessing to ensure accuracy and consistency. Here are some articles to know more about it:
- Handling Missing Data
- Removing Duplicates
- Pandas Change Datatype
- Drop Empty Columns in Pandas
- String manipulations in Pandas
- String methods in Pandas
- Detect Mixed Data Types and Fix it
Pandas Operations
We will cover data processing, normalization, manipulation and analysis, along with techniques for grouping and aggregating data. These concepts will help you efficiently clean, transform and analyze datasets. By the end of this section, you’ll learn Pandas operations to handle real-world data effectively.
- Data Processing with Pandas.
- Data Normalization in Pandas
- Data Manipulation in Pandas
- Data Analysis using Pandas
- Grouping and Aggregating with Pandas
- Different Types of Joins in Pandas
Advanced Pandas Operations
In this section, we will explore advanced Pandas functionalities for deeper data analysis and visualization. We will cover techniques for finding correlations, working with time series data and using Pandas' built-in plotting functions for effective data visualization. By the end of this section, you’ll have a strong grasp of advanced Pandas operations and how to apply them to real-world datasets.
- Finding Correlation between Data
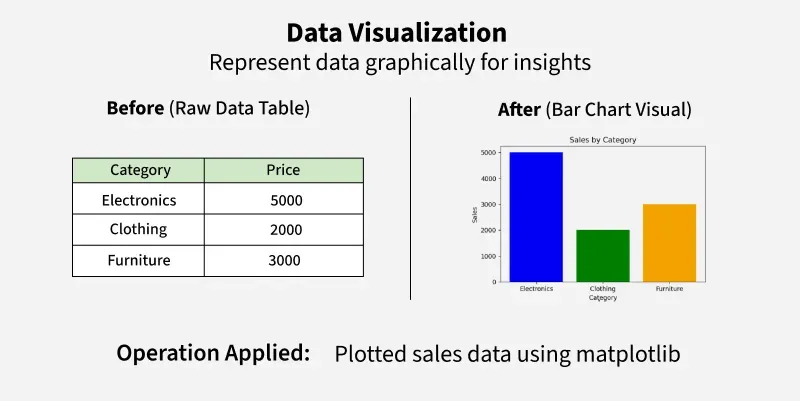
- Data Visualization with Pandas
- Pandas Plotting Functions for Data Visualization
- Basic of Time Series Manipulation Using Pandas
- Time Series Analysis & Visualization in Python
Pandas Quiz
Test your knowledge of Python's pandas library with this quiz. It's designed to help you check your knowledge of key topics like handling data, working with DataFrames and creating visualizations.
Projects
In this section, we will work on real-world data analysis projects using Pandas and other data science tools. These projects will cover various domains, including food delivery, sports, travel, healthcare, real estate and retail. By analyzing datasets like Zomato, IPL, Airbnb, COVID-19 and Titanic, we will apply data processing, visualization and predictive modeling techniques. By the end of this section, you will gain hands-on experience in data analysis and machine learning applications.
- Zomato Data Analysis Using Python
- IPL Data Analysis
- Airbnb Data Analysis
- Global Covid-19 Data Analysis and Visualizations
- Housing Price Analysis & Predictions
- Market Basket Analysis
- Titanic Dataset Analysis and Survival Predictions
- Iris Flower Dataset Analysis and Predictions
- Customer Churn Analysis
- Car Price Prediction Analysis
To Explore more Data Analysis Projects refer to article: 30+ Top Data Analytics Projects in 2025 [With Source Codes]


