
The use of electronic navigation equipment has improved the general quality of aircraft wind observations (PIREPS). Since the early 1960's most of the observations have been concentrated at jet aircraft flying levels-between 30,000 (9,000) and 40,000 ft (12,000 m). Numerous commercial airline routes traverse the tropical and equatorial regions where data from fixed stations are extremely sparse. Sadler (1965) demonstrated the utility of PIREPS for daily global tropical analyses and the data have been routinely used in operational analyses and forecasts for the global tropics since 1966 (Vanderman, 1967). PIREPS have also been used in many studies to obtain the mean monthly flow for tropical regions. Among these are those of Aspliden et al. (1966); Pearson (1968); Ramage and Raman (1972). In a previous study (Sadler, 1972) I meshed some 900,000 AIREPS for the period 1960-1968 with the fixed station radiowinds and radarwinds (RAWINS) to determine mean monthly 200, 250, and 300 mb winds over the central and eastern Pacific Ocean. This atlas extends that work to the global tropics with the addition of data through 1973. Grid point data will be extracted for the zone between 45N and 30S. To reduce boundary uncertainties the analyses were extended poleward of these limits, where data permitted.
Aircraft wind observations at 28,000 ft (8,500 m) and above for the period 1960-1973 were collected from many sources and compiled. Operational manuscript maps of the National Weather Service in Honolulu, Hawaii were the source for most of the Pacific data west of 120W from 1960-1968. A daily listing of Pacific PIREPS subsequent to 1968 was obtained from the Fleet Weather Central at Pearl Harbor. The major source for the Atlantic area was microfilmed manuscript charts from the National Weather Service Regional Forecast Center in Miami, Florida covering the period 1964-1973. Over Africa and the Middle East, observations were extracted from airline navigator logs mailed to the University of Hawaii. Navigator logs were also used for the Pacific east of 120W and in the Australian region and were supplemented over the Indian Ocean area by observations collected during the International Indian Ocean Expedition (Nicholson, 1968) and by a special collection effort of the Meteorological Office in Perth, Australia.
The monthly composite data sample averaged approximately 175,000 observations; a typical monthly distribution by 5 degree squares between 45N and 40S is shown in Fig. 1. The greatest concentration of observations is along the air routes emanating from Honolulu. Five cross equatorial sections have more than 100 observations per 5 degree square. Two are in the eastern Pacific and one each in the central Atlantic, central Africa, and the eastern Indian Ocean. There are large oceanic data gaps. Most are due to lack of air routes but a few are due to collection inefficiency.
Four sets of monthly mean resultant winds were computed for each 5 degree latitude-longitude grid square and located at the averaged position of the reports. The first set was a composite of all observations. In order to mesh with the RAWINS at constant pressure surfaces, the other three sets were stratified into the following height intervals: 28,000-33,000 ft or 8,500-10,000 m (300 mb); 33,000-37,000 ft or 10,000-11,000 m (250 mb); and 37,000 ft or 11,000 m and above (200 mb). Wind steadiness** and percentage of observations with an easterly component were computed to aid interpretation and analysis.
**wind steadiness (%)= [mean resultant wind speed/mean wind speed] x 100
Figure 1. Typical monthly distribution of wind observations from pilot reports (PIREPS).
90E to 90W
90W to 90E
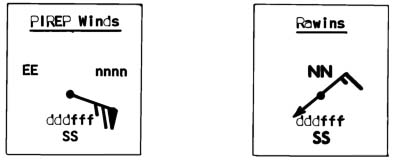
Figure 2. A typical monthly data base analysis from a composite of the PIREPS. See section 2.3 for plotting model.
60E to 120WIt becomes obvious on studying the charts that the upper tropospheric flow patterns can be rather complex, particularly during summer. Therefore, discussion will be aided if major circulation features are identified and labeled. The complex Northern Hemisphere systems of August are shown in Fig. 3. The spiral configuration of the ridges as proposed by Sadler (1963) is confirmed and the double ridges over the oceans are quite well positioned by the PIREP data. When only a single ridge exists in a hemisphere or portions of a hemisphere, it will be referred to as the subtropical ridge. When a double ridge system exists, the lower latitude ridge is designated the subequatorial ridge and the higher latitude ridge is designated the subtropical ridge. Note that the subequatorial ridge of the western and central North Pacific becomes the subtropical ridge across the United States and the North Atlantic. The subequatorial ridge of the eastern North Pacific, northern South America and the North Atlantic becomes the subtropical ridge over Africa, Asia, and the North Pacific.
Figure 3. The location of Northern Hemisphere troughs, ridges, and major currents at 200 mb during August.
northern hemisphere 200 MbThe trough between the subequatorial and subtropical ridge will be referred to as the Tropical Upper-Tropospheric Trough (TUTT). It is commonly called the Mid-Pacific Trough (MPT) in the central Pacific and the Mid-Atlantic Trough (MAT) in the central Atlantic. The term "Tropical Upper-Tropospheric Trough" is preferred since similar troughs exist during summer in the Southern Hemisphere, eastern North Pacific, Central America, and the Gulf of Mexico. On occasion-for.shorter periods it is observed as a continuous feature extending from the Mediterranean Sea to Asia (Sadler, 1963)..
Figure 4. A schematic of the 200 mb ridge development in the Northern Hemisphere over the eastern Pacific and the concurrent establishment of a buffer system in the equatorial region.
(a) January (b) JanuaryA near-equatorial system which needs defining results from the development and existence of a primary system in one hemisphere without a counterpart in the opposite hemisphere. The evolution of a near-equatorial system in the eastern Pacific is depicted in Fig. 4 by sketches of the changing 200-mb features from January to August. In January [Fig. 4(a)], westerly flow covers the equatorial region east of 170W in the absence of a ridge system in either hemisphere. In May, a ridge forms over the eastern North Pacific between 10N and 15N, and by June [Fig 4(b)], it extends westward to near 140W. Easterly winds are established south of the ridge line. No counterpart ridge forms in the Southern Hemisphere and westerlies exist from the equator southward. A counterclockwise turning wind system is therefore established between the westerlies of the Southern Hemisphere and the easterly flow south of the ridge line. The ridge continues to strengthen and move northward, and by August [Fig. 4(c)], mean easterly flow is established across the North Pacific south of the ridge line. A similar system forms in the Atlantic in late May when the Northern Hemisphere ridge begins to extend westward from Africa. Also by late May the South American anticyclone of the Southern Hemisphere summer disappears and westerlies extend northward to the equator. By July the Northern Hemisphere subequatorial ridge is well established across the Atlantic, northern South America, and the eastern Pacific and the near equatorial counterclockwise turning wind system is continuous from the central Pacific to the central Atlantic. The axis of the system, lying very near the equator, can move back and forth across the equator and also slope with height across the equator. For example, during July and September the average position at 200 mb is just north of the equator and at 300 mb just south of the equator. During August, when the Northern Hemisphere northeasterlies are strongest in the eastern Pacific and eastern Atlantic, the average axis at 200 mb is "pushed" south of the equator in the Atlantic and extreme eastern Pacific but remains north of the equator over South America and the eastern Pacific between 140W and 160W. The sense of rotation is cyclonic when the system axis is north of the equator and anticyclonic when south of the equator. Similar circulation systems in the lower troposphere over the western Pacific and Indian Ocean have been referred to as buffer systems (Sadler and Harris, 1970), implying only a wind-turning zone between two independently driven, oppositely-directed wind systems. The same nomenclature of buffer system will be used herein.
A buffer system of the opposite sense (clockwise) is formed during the Southern Hemisphere summer (November-March) between outflow of the anchored anticyclone over South America and the surrounding westerlies of the Northern Hemisphere and equatorial Pacific and Atlantic.
The westerly currents of tropical latitudes which are distinct from the temperate westerlies will be referred to as the subtropical westerlies. These currents normally exist equatorward of the tropical upper-tropospheric troughs and are therefore a seasonal feature.
The westerly currents of the equatorial region are usually equatorward extensions of the temperate westerlies or of the subtropical westerlies. However, distinct equatorial westerlies are observed over the eastern Pacific from October to April and over the central Atlantic from October to January.
Figure 3 shows the major currents of August in the Northern Hemisphere. The spiral configuration of the ridge systems is also present in the wind streams. The subtropical westerlies become a branch of the temperate westerlies and the subtropical easterlies merge into the tropical easterlies.
This discussion focusses only on the very gross features of the upper tropospheric circulation in terms of their (1) position and intensity change with time; (2) asymmetries with respect to latitude; (3) asymmetries with respect to longitude; and (4) associations with convective energy sources.
As aids to the interpretation of the analyzed charts, time-latitude cross sections along eight selected longitudes have been extracted from the 200 mb analyses. These sections (Fig. 5) depict the positions of the subtropical and subequatorial ridges, the tropical upper tropospheric troughs, the buffer systems, the position and strength to the nearest 5 kt of major air streams between approximately 45N and 30S, and the direction and speed of the wind at the equator.
Figure 5. Selected time-latitude cross sections extracted from the 200 mb analyses showing the positions of troughs (dashed lines), ridges (solid lines), major currents (arrows), the speed of the currents (nearest 5 kt), and the direction and speed of the equatorial winds.
In addition, the zonal and meridional components of the equatorial wind at 200 mb have been extracted for the months of August (Fig. 6) and February (Fig. 7).
Figure 6. A longitudinal cross section of the mean meridional wind (kt) at the equator for August and February. The zonal averages from Table 1 are indicated by the dashed lines.
Figure 7. A longitudinal cross section of the mean zonal wind (kt) at the equator for August and February. The zonal averages from Table 1 are indicated by the dashed lines.
Distribution of the mean tropical convective cloudiness is closely related to energy sources through the release of latent heat of condensation. Cloudiness maps are available in Sadler (1968), Atkinson and Sadler (1970), or Miller and Feddes (1971). In general 200 mb ridges lie poleward of zones of maximum convective cloudiness and thus facilitate cross-equatorial outflow into the opposite hemisphere.
In addition, the longitudes of maximum cross equatorial flow (Fig. 6) and of maximum tropical convective cloudiness nearly coincide. Except for the eastern Pacific and central Atlantic Ocean, where the near equatorial cloud zone remains in the Northern Hemisphere, the regions of maximum convective cloudiness are found in the summer hemisphere. Note in Fig. 6 that only in the eastern Pacific and central Atlantic is flow from the winter to the summer hemisphere.
The eight time-latitude cross sections of Fig. 5 have been grouped by Eastern Hemisphere and Western Hemisphere because of the similarities of ridge systems and equatorial flow within each hemisphere and the striking difference between the two hemispheres. The differences stem from the fact that in a rough sense the Eastern Hemisphere is continental and the Western Hemisphere oceanic. The Eastern Hemisphere experiences extensive summer monsoons in both the Northern and Southern Hemispheres (Ramage, 1971) while in the Western Hemisphere only a restricted monsoon of the Northern Hemisphere summer occurs. Tropical easterlies between the subtropical ridges of the Northern and Southern Hemispheres are characteristic of the equatorial region of the Eastern Hemisphere but are rare in the Western Hemisphere.
Also, in a gross sense the Northern Hemisphere is continental and the Southern Hemisphere oceanic. This effect on the upper tropospheric circulation is well illustrated by the ridge positions over the Eastern Hemisphere. Over Africa, with land masses in each hemisphere, but more in the Northern Hemisphere, the ridge has an annual latitudinal range of some 20 degrees in the Northern Hemisphere compared to 15 degrees in the Southern Hemisphere. Over the Indian Ocean region (80E), with land in only the Northern Hemisphere, the latitudinal range of the ridge is 22 degrees in the Northern Hemisphere but only 7 degrees in the Southern Hemisphere.
In the Eastern Hemisphere there is a semiannual oscillation in the latitudinal position of the ridges. The summer hemisphere ridge has a normal poleward movement with the march of the sun; however, in the winter hemisphere the ridge also moves poleward in opposition to the march of the sun. This may be due to the dominance of the summer hemisphere cross-equatorial outflow which "pushes" the ridge poleward in the winter hemisphere. The winter ridge, then, is best viewed as an inertial system (similar to the buffer system) whose latitude is determined by the strength of the cross-equatorial outflow from the summer hemisphere. The semiannual oscillation is much more apparent in the Southern Hemisphere because the cross-equatorial outflow from the Northern Hemisphere summer monsoons is much stronger than from the weaker Southern Hemisphere summer monsoons.
Therefore, in the Eastern Hemisphere, over the equator and the near-equatorial region between the ridges, the zonal component of the wind has a semiannual cycle with maxima in winter and summer separated by minima during the two transition seasons. In the Western Hemisphere, devoid of double summer monsoon systems, the cross-equatorial exchange between hemispheres is much weaker and more complex since convective heating remains in the winter hemisphere over the near-equatorial eastern Pacific and central Atlantic. Near-equatorial stations in the Western Hemisphere do not observe a semiannual cycle in the zonal winds (Frost, 1970).
The meridional component of the equatorial tropical easterlies has an annual cycle over the Eastern Hemisphere. It is always directed from the summer to the winter hemisphere: i.e., southerly from November to March and northerly from May to October, and approaches zero during the spring and fall transitions. Fig. 6 illustrates this well for the midseason months of February and August. It also shows the complexity of the Western Hemisphere where the cycle of the meridional component is longitudinally dependent. During August when the major convective heating is in the summer (Northern) hemisphere over all longitudes, flow is northerly along the equator. During February, as mentioned earlier, the near-equatorial convective cloud zone lies in the winter hemisphere over the eastern Pacific and central Atlantic; Fig. 6 shows strong northerly flow from winter to summer hemisphere over the eastern Pacific in the longitudes of maximum cloudiness. In the central Atlantic cloudiness is somewhat less and is near zero.
(a) 20E
This section almost bisects the South Africa summer anticyclone, and traverses the maximum tropical southeasterlies of the South Africa summer monsoon. It skirts the eastern edge of the maximum tropical northeasterlies of the North Africa summer monsoon, which are separate and distinct from the tropical easterlies of the south Asia summer monsoon, which enter eastern Africa near 13N. (See August chart and 40E section.)
The axis of the Northern Hemisphere temperate westerlies remains near 26N for most of the year but oscillates northward and southward with the subtropical ridge from June to September. Their maximum speed of 90 kt occurs in winter with a secondary maximum of 65 kt in summer. Minima of 50 kt and 45 kt occur in June and September, respectively.
In the Southern Hemisphere, the axis of the temperate westerlies entering west Africa is located along 25S from April through August, with a maximum speed of 70 kt in June and July. The axis moves southward off the continent by October.
(b) 40E
This section was chosen because it passes through the only area in the Eastern Hemisphere where the double ridge structure temporarily disappears and westerlies are observed on the equator. This occurs in October and November over east Africa and the western Indian Ocean between 30E and 50E. Almost clear skies prevail during this period off the east African coast between 40E and 50E northward of 20S. Lack of a convective heat source probably contributes to the ridge decay.
The temperate westerlies over north Africa and the Middle East reach a maximum near this longitude, with speeds of 100 kt in February.
The poor data in the Southern Hemisphere can only suggest the absence of a temperate westerlies maximum poleward of 30N.
During July and August the axis of the south Asia tropical easterlies reach this longitude near 13N with a speed of 40-45 kt. (See 20E section.)
(c) 80E
This section traverses the Tibetan summer anticyclone and the maximum tropical easterlies of the South Asia summer monsoon.
The movements of the Northern Hemisphere subtropical ridge and temperate westerlies are quite similar to those at 20E and 40E. The ridge moves from its southernmost position of 7N in April to 30N in July and August and then returns more slowly in the fall, reaching 11N by December.
The temperate westerlies remain near 27N from November to April but move in unison with the ridge from May to October. Their maximum speed is 90 kt in January and February. A secondary summer maximum of 65 kt is observed in July and August near 42N. Speeds of 55 kt occur in May and June and the minimum of 50 kt in September.
The Northern Hemisphere tropical easterlies reach speeds of 50 kt in June, July, and August. Their axis moves from 3N in May to 9N in July and August and then returns to 3N by November.
As discussed earlier the ridge in the Southern Hemisphere moves through a range of only 7 from 16S in February to 9S in April and May. In July and August the strong cross-equatorial outflow from the South Asia summer monsoon "pushes" the ridge poleward to near 15S, only slightly equatorward of its midsummer position. The semiannual cycle is as well marked as in the 20E and 40E sections.
The PIREPS collected at Perth, Australia for the South Indian Ocean permit a reasonable analysis of the temperate westerlies of the Southern Hemisphere. During summer, from November through March, there is no obvious maximum axis equatorward of 30S. In winter the axis lies near 30S attaining a maximum speed of near 80 kt in July.
(d) 150E
This section, just east of Japan and Australia, samples the maximum temperate westerlies of both hemispheres. In the Northern Hemisphere the speed exceeds 140 kt in January and February near 33N. The axis moves northward to 45N in August but lowest speed (45 kt) is recorded in July. In the Southern Hemisphere the maximum speed is slightly over 100 kt in July. The axis shifts only about 3 degrees, between 25S and 28S, through the year. A weak tropical upper tropospheric trough disrupts the westerlies in January and February.
This section crosses the western end of the north Pacific TUTT which is well marked at this longitude from June to October. It moves northward from 18N in June to 23N in August and then returns to 17N in October. The summer subtropical ridge moves in unison from 25N in June to 30N in August and then southward to 22N in October. The subequatorial ridge also migrates in the same sense from 8N in June to 16N in August and then southward to 13N in October. The subtropical easterlies, between the subtropical ridge and the TUTT, average 5 to 10 kt and the subtropical westerlies, between the TUTT and the subequatorial ridge, average less than 10 kt.
The Northern Hemisphere subtropical ridge is farthest south (6N) in May. This contrasts with 18N at 100E (see May chart) where by May the deep convective cloudiness of the South Asia summer monsoon is already established over the Andaman Sea and along the Burma coast (Sadler, 1969).
The semiannual cycle of the zonal wind along the equator and the positions of the ridges in both hemispheres are well marked at this longitude. However, in contrast to the semiannual cycle over the continental sections at 20E, 40E, and 80E, there is an annual cycle in the speed of the Northern Hemisphere temperate westerlies.
(e) 150W
This section was selected mainly to represent the only region-140W-160W-where the mean equatorial flow is westerly in all months. The speed of the equatorial westerlies has an annual cycle, being maximum from December to March and minimum from June to September.
The Northern Hemisphere summer subtropical ridge forms over the eastern North Pacific in May (see 110W section) and extends westward to 150W by July. It remains through September near 10N then retreats eastward. The accompanying tropical easterlies are weak and the buffer system lies just north of the equator.
This section intersects the TUTT of both hemispheres. In the Northern Hemisphere it crosses near where the eastern end of the TUTT merges with the mean trough in the midlatitude westerlies; therefore, the subtropical ridge, which normally lies poleward of the TUTT, does not show at this longitude.
The Southern Hemisphere TUTT is positioned near 10S from December through April while the subtropical ridge lies near 20S.
The axis of the Southern Hemisphere temperate westerlies, which is located between 27S and 30S from April through November with a maximum speed of 90 kt in July, decays or moves south of 30S during summer.
The Northern Hemisphere temperate westerlies of winter have only a narrow single axis at 150E. However they spread and branch near 180 degrees and at 150W consist of two currents of near equal strength from December through March. The speed of each is about one-half the speed of the single current at 150E. In April the link of the southern current to the temperate westerlies of the Western Pacific begins to fracture and by May it is a distinct current of subtropical origin separated from the temperate westerlies by the TUTT and subtropical ridge. Speed increases in the northern branch in June and October (Sadler, 1972).
(f) 110W
This section crosses the summer monsoon of the northeast Pacific and the summer anticyclone over the southwestern United States and northwestern Mexico.
The subtropical ridge forms near 13N over Central America and the eastern North Pacific in May, moves northward to 18N by July and becomes the subequatorial ridge during July and August when a separate anti cyclone forms over the southwestern United States and northwestern Mexico centered near 32N, 110W. The northernmost (subtropical) ridge persists only through July and August, and the TUTT, between the two ridges, lies across Mexico near 24N. In September the subtropical ridge at 20N begins moving south and reaches 10N in October before decaying. The tropical easterlies centered near 7N are strongest in August. In August and September the northeast outflow from the eastern Pacific summer monsoon is sufficiently strong to "push" the buffer system south of the equator and easterly winds are observed along the equator during these two months.
The Northern Hemisphere temperate westerlies persist across the Baja Peninsula and northwestern Mexico near 27N from November through May even though upstream (see 150W section) there is considerable latitudinal movement of the axis from March to April and again from November to December as the Pacific TUTT forms and decays, respectively. The highest speed, in late winter and spring (February-May), coincides with maximum tornado frequency over the United States. In July, when the anticyclone forms near 32N, westerlies diminish and the axis moves rapidly northward to 47N where the speed of 50 kt is a maximum for the northwest United States at this longitude.
There is no ridge in the Southern Hemisphere at this longitude. Northwesterlies near 10S from November through April emanate from the equatorial region between 130W and 150W and extend across South America near 30S (see 60W section). The position of the temperate westerlies near 30S is based mainly on recent observations at Easter Island.
(f) 110W
This section through central South America passes just east of the center of the Southern Hemisphere summer anticyclone near 13S, 70W. The ridge extends southeastward from the anticyclone and crosses 60W near 15S in January and February.
This section also crosses the summer TUTT of the North Atlantic, which is well developed in July and August near 28N between the subtropical ridge near 33N and the subequatorial ridge along 12N. The associated subtropical easterlies and subtropical westerlies are light with speeds of 5 kt and 10 kt, respectively.
The equatorial and tropical wind fields are also very weak at this longitude. During the Southern Hemisphere summer tropical easterly outflow from the deep convection over South America has speeds of only 10 kt to 15 kt. As a result the Northern Hemisphere westerlies extend to and across the equator, keeping the buffer system in the summer hemisphere. The latitudinal movements of the ridge and buffer systems exhibit an annual cycle with minor distortions during the transition seasons. A station at 7S or 7N would record an annual cycle in the zonal wind; however, because the buffer systems lie in the summer hemispheres, a station within about 2 degrees latitude of the equator would record a semiannual cycle of alternating easterlies and westerlies.
Across southern South America there is not much variability in the strength of the temperate westerlies. They are only slightly weaker in midsummer than in midwinter. The maximum winter speeds are about 10 kt less than over southern Africa and much less than over Australia. Unlike the other two areas, a maximum speed axis remains equatorward of 35S during summer. This feature is linked to the northwesterlies originating in the equatorial region (see sections at 110W and 150W), which, as discussed above, are associated with the zone of maximum convective cloudiness in the Northern Hemisphere.
The westerlies of the western North Atlantic are rather complex. A single current of 80 kt near 37N in January and February decreases to 65 kt in March and branches in April. The southern branch moves southward to 15N in June and decreases to 20 kt. The link to the temperate westerlies is broken in June by the TUTT and subtropical ridge and the westerlies are of subtropical origin from July-October. After the split in April the northern branch moves poleward of 45N from June-September.
(h) 30W
This section through the Atlantic was selected to show the seasonal extent of the equatorial westerlies and the marked differences between the near-equatorial circulations of this oceanic section and the continental sections on either side, at 60W and 20E.
The Northern Hemisphere subtropical ridge builds westward from Africa and reaches 10N, 30W in June. It moves northward to 16N in July and August and then southward as it withdraws eastward to disappear from the section by October.
Equatorial easterlies are observed only in August and September when the buffer system is just south of the equator. The zonal wind on the equator has an annual cycle in contrast to the semiannual cycle at 60W and 20E.
The section crosses the eastern end of the North Atlantic TUTT near the longitude where the TUTT and the long wave trough in the midlatitude westerlies merge. A similar relationship is revealed by the section at 150W.
The section also crosses the Southern Hemisphere TUTT, which is pronounced off the South American coast from December to February. Its position, which is based on observations along the coast and from Ascension Island, may have to be considerably modified as observations become available over the South Atlantic.
The position and strength of the temperate westerlies indicated along 30S are also uncertain because observations are lacking.
In the eastern Atlantic the Northern Hemisphere temperate westerlies remain poleward of 45N during most of the year. The westerlies between 15N and 27N are linked to the temperate westerlies over the western Atlantic during March through May but have a subtropical origin during June through November.
Tropical upper tropospheric troughs are a summer feature of the oceans. They are best developed in the North Pacific and in the North Atlantic, Caribbean, and Gulf of Mexico. In the Southern Hemisphere the most pronounced TUTT is in the east central Pacific with weaker ones east of Australia, South America and perhaps Africa. TUTTs can be defined in terms of either the speed field or the direction field. When defined as a distinct minimum speed zone separating the temperate and subtropical westerlies, the North Pacific TUTT lasts from May through November and the North Atlantic TUTT from June through October. When defined as a well-marked trough oriented more or less east-west, TUTT lasts from June to October in the North Pacific and from July to September in the North Atlantic. The North Pacific TUTT is best developed and farthest north in August. In the North Atlantic there is little distinction in intensity or position between July and August.
The dense RAWIN network in French Polynesia and observations from the recently established station at Easter Island fix the duration of the TUTT in the east central South Pacific as November through April; it is best developed in January and February.
In the Northern Hemisphere temperate zone minimum wind speeds are observed over the eastern oceans and west sides of continents and maximum winds are observed east of continents. The opposite is observed in the Southern Hemisphere with maximum winds over eastern oceans and the west coasts of South America and Africa, and minimum speeds over the east coasts. In the Australian region, the maximum axis has a large longitudinal extent and speeds are only slightly greater on the west coast than on the east coast.
The patterns of intense thermal gradients of the Northern Hemisphere winter are determined mostly by the distribution of land masses in mid- and high latitudes. However, it would appear from these analyses that cross-equatorial outflow from the summer hemisphere plays a significant role in determining position and intensity of the maximum westerlies of the winter hemisphere. This is particularly noticeable in the Southern Hemisphere where there is little land between 30S and 70S and the maximum westerlies are observed on the "wrong" sides of continents. In August the longitudes of the maximum westerlies closely correspond to the longitudes of the maximum cross-equatorial flow (Fig. 6). In February correspondence between the cross-equatorial flow and the longitudes of maximum westerlies in the Northern Hemisphere is also quite good but less striking.
Significant flow from the winter to the summer hemisphere occurs in the eastern Pacific between 150W and 110W during the Northern Hemisphere winter. Northwesterlies originate in the near-equatorial region where the maximum convective cloudiness (or heat source) is found north of the equator in the winter hemisphere. The northwesterlies, which are quite strong over the eastern South Pacific (see 110W section), may be responsible for the unseasonably strong and equatorward-displaced westerlies over western South America (see discussion of the section at 60W).
No extensive comparison with previous studies has yet been attempted; however, some indication of possible differences is given by Table 1. This compares my zonal averages of mean u and v components of the wind along the equator with those of Oort and Rasmusson (OR) [1971] for February and August.
Table 1. Comparison of Equatorial [u] and [v](knots)
| Ave | February | August | ||
|---|---|---|---|---|
| - | Sadler | OR | Sadler | OR |
| [u] | -2.8 | -13.2 | -16.6 | -19.2 |
| [v] | +5.7 | +6.6 | -8.9 | -4.9 |
Features of the rainfall climatology of many tropical and equatorial region can be explained by either the lower tropospheric mean circulation or the majority of current synoptic models which involve convection being initiated by convergence associated with lower tropospheric features.
The upper tropospheric data base is becoming sufficiently detailed in some areas to suggest that many of the clues to rainfall "anomalies," "mysteries," "singularities," etc., lie in the upper tropospheric circulation and an increasing number of synoptic models depend on divergence in the upper troposphere to initiate tropical convective systems (Ramage, 1962; Sadler, 1967, 1974, 1975).
I will cite three examples of "anomalous" rainfall regimes, which probably result from a mean large scale feature of the upper troposphere.
The Hawaiian Islands have a winter maximum rainfall regime which is usually attributed to frontal systems and cutoff lows in the upper troposphere. However, in April there is a peak in rainfall and in the frequency of occurrence of heavy rains, neither of which can be attributed to an increase in frontal systems nor cutoff upper tropospheric lows. The monthly analyses and the cross section at 150W (Fig. 5) show a major change in the upper tropospheric flow. The maximum speed axis in the westerlies moves southward through the Islands from March to April and speeds at the axis are greatest in April.
The Caribbean has a summer maximum rainfall regime within which there are early (May) and late (September and October) peaks separated by a relative minimum in midsummer. The late summer peak is usually attributed to the occurrence of tropical cyclones. This may be partially true but of course cannot account for the May maximum nor for the midsummer minimum. The upper tropospheric analyses and the cross section at 60W (Fig. 5) show that (as in the Hawaiian region (the maximum axis of a westerly current migrates southward into the Caribbean in May and then decays in June when the TUTT forms between the double ridges.
Another region for intriguing speculation is Northeast Brazil where the midsummer rainfall is much below expectations and the maximum is observed in the late summer and early fall (March-May). The lower tropospheric mean flow (Atkinson and Sadler, 1970) offers no obvious reasons for this "anomaly." However, the upper tropospheric circulation changes appreciably between mid and late summer. During December-February the Northern Hemisphere westerlies and outflow from intense convection over central and western Brazil, between them create a buffer system across Northeast Brazil. This anchored strong cyclonic (convergent) flow aloft must be compensated in the lower levels by sinking divergent flow that in turn inhibits precipitation. Perhaps then, the intensity of the summer rains of central and western Brazil in part control the variability of rainfall over Northeast Brazil. The buffer system position and intensity also depends on the intensity and direction of the Northern Hemisphere westerlies. Namias (1972) has shown a strong relationship between Northeast Brazil rainfall and the variation of the Northern Hemisphere westerlies; however, he makes no reference to the upper tropospheric circulation over Brazil but proposes an inconsistent complex sequence of events linking the lower troposphere of the two hemispheres.
This work was supported by the National Science Foundation under Grant GA-36301.
Particular thanks are due the many airlines who responded to our request for data logs--Air Canada, Aeronaves De Mexico, Canadian Pacific, Koninklijke Luchtvaart Maatschappij (KLM), Lufthansa, Philippine Air Lines, Pan American, Sabena, Scandinavian Airlines System (SAS), South African Airways, Qantas, Union De Transports Aeriens (UTA). Mr. Roy Jenne of the National Center for Atmospheric Research supplied much of the fixed station data base and the Australian Bureau of Meteorology at Perth lent their PIREP collectives. Professor Colin Ramage made available the International Indian Ocean Expedition data collection and Mr. C. R. V. Raman of the India Meteorological Department, while at the University of Hawaii, gave advice and encouragement during the initial stages of the data collection. The Navy Weather Research Facility and its successor, the Navy Environmental Prediction and Research Facility supported an earlier Pacific study, the data base of which was incorporated in this study. Ms. Ethel Masaki and many students extracted and compiled the data. Ms. S. Arita typed the manuscript. Ms. Marilyn Frydrych and Mr. Bernie Kilonsky programmed the data processing. Special thanks to Mr. Louis Oda for aid in data processing and for drafting the figures and charts.
Thank you!