


ABSTRACT
High-dispersion (
Export citation and abstract BibTeX RIS
1. ESTABLISHING DIVERSITY IN COMETARY COMPOSITION
The composition of comets provides a major observational constraint in cosmogony. The volatiles and dust stored in comet nuclei preserve a physicochemical record for the conditions (temperature, pressure, radiation field density) under which cometary material formed (Wooden 2008; DiSanti & Mumma 2008; Bockelée-Morvan et al. 2004; Irvine et al. 2000; Mumma et al. 1993).
Comparing relative abundances of parent6 molecules (H2O, HCN, CO, etc.) in comets to those found in the interstellar medium (ISM) and in disks around young stars is vital to understanding the different stages of planetary system formation and the processing history experienced by organic matter during the evolutionary transitions between these stages (see Charnley & Rodgers 2008a, 2008b; Carr & Najita 2008; Ehrenfreund et al. 2006; Gibb et al. 2007a; Boogert et al. 2004; Nuth et al. 2000). Measuring the native6 volatile composition of comets tests dynamical models for the early solar system (Böhnhardt et al. 2008, Kobayashi et al. 2007, Mumma et al. 2005). Studies of comets are also important for assessing the possibility of exogenous delivery of water and prebiotic organics to early Earth as a hypothesized precursor event(s) leading to development of the biosphere (Delsemme 1998, 2000).
Spectroscopy has revealed a number of molecules released from comet nuclei and a significant diversity in the relative abundances (or "mixing ratios") among them (see DiSanti & Mumma 2008; Crovisier 2006; Dello Russo et al. 2008; Magee-Sauer et al. 2008b; Biver et al. 2002; Mumma et al. 2001). This chemical diversity has yet to be fully explored, because the sample of observed comets is fairly small, especially at infrared (IR) wavelengths where molecules with no permanent dipole moment (CH4, C2H2, C2H6) can be uniquely sensed.
Moreover, in addition to mixing ratios (e.g., CH4/H2O, HCN/H2O, CO/H2CO/CH3OH, etc.), other (possible) cosmogonic signatures such as isotopic (D/H, 15N/14N) and nuclear-isomeric (ortho-para, A:E:F, etc.) ratios in particular species are of keen interest in cometary science. With few exceptions, the knowledge of these important "observables" is very limited (see the reviews of Charnley & Rodgers 2008a; Crovisier 2006). In the case of methane (of particular interest in this work), an upper limit for CH3D/CH4 equal to 0.04 (95% confidence limit) was found in comet C/2004 Q4 (NEAT) (Kawakita et al. 2005), based on a single spectral line. The same work also reported a spin temperature for CH4 (Tspin ∼ 33 K, corresponding to the A:E:F nuclear isomeric ratio). Measurements of both deuterium enrichment and spin temperatures of various species in many more comets are critical for testing possible variations among the comet population. The inter-relation of such measurements with other plausible cosmogonic indicators (mixing ratios of parent volatiles, properties of cometary dust) will (likely) clarify the origin of cometary material.
This paper summarizes the results from our comprehensive study of parent volatiles in comet C/2004 Q2 (Machholz),7 observed with the Near InfraRed echelle SPECtrograph (NIRSPEC; McLean et al. 1998) at the W. M. Keck Observatory atop Mauna Kea, Hawaii. We detected a number of parent volatiles and conducted a sensitive search for CH3D. We highlight three principal results:
- 1.An upper limit for the deuterium enrichment of methane (CH3D/CH4).
- 2.An lower bound for the spin temperature of methane.
- 3.Mixing ratios of CH4, C2H2, C2H6, H2CO, CH3OH, HCN, and NH3 relative to H2O, measured (or stringently constrained) at heliocentric distances of 1.49
AU and 1.21AU . Mixing ratio CO/H2O measured at 1.48AU .
In Section 2, we describe our observations of comet Q2/Machholz. In Section 3, we compare the mixing ratios of several parent volatiles with respect to H2O, measured at heliocentric distances of 1.49
2. OBSERVATION OF C/2004 Q2 (MACHHOLZ) WITH NIRSPEC AT KECK 2
Comet C/2004 Q2 (Machholz) was discovered on 2004 August 27 (Machholz et al. 2004) and reached naked-eye brightness (V < 4m) by 2005 January. Q2/Machholz belongs to the dynamical class of "nearly isotropic comets," whose dynamical reservoir in the present-day solar system is most likely the Oort Cloud (Levison 1996). It has a highly eccentric (e > 0.999) orbit. As a result of the comet's passage in the inner solar system, the 1/a orbital parameter changed from 0.000408 to 0.0004433. The comet's closest approach to Earth (geocentric distance
Via different methodologies three optical studies revealed the following rotation periods (P) for the nucleus of C/2004 Q2. Farnham et al. (2007) reported P = 17.60 ± 0.05 h based on CN coma morphology. Sastri et al. (2005) reported P = 9.1 ± 1.9 h based on modeling dust fans visible in R-band images. Reyniers et al. (2009) reported P = 9.1 ± 0.2 h based on the light-curve analysis of optical broadband images. The latter study considers the possibility that their method has sampled one half instead of the full period.
We observed Q2/Machholz with NIRSPEC at the Keck-2 telescope on 2004 November 28–29 and on 2005 January 19 (UT dates). Table 1 shows condensed observing logs and derived water production rates. During the first observing run, we quantified the production rates and relative abundances of several species commonly observed at IR wavelengths, including H2O, CH4, HCN, C2H6, CH3OH, CO, and H2CO. The observing circumstances were exceptionally favorable in January, allowing (in addition to measuring the overall volatile composition) detections of weaker species (acetylene, ammonia) and a sensitive search for mono-deuterated methane.
Table 1. Observing Log and H2O Production Rates
| UT Date | NIRSPEC Setting | Rh ( |
dRh/dt (km s−1) | d |
Tint (minutes) | Q(H2O) (1026 s−1) | |
|---|---|---|---|---|---|---|---|
| 2004 Nov 28 | KL1 | 1.493 | −15.2 | 0.654 | −21.7 | 8 | 1535 ± 69 |
| KL2 | 1.493 | −15.2 | 0.655 | −21.8 | 20 | 1435 ± 124 | |
| 2004 Nov 29 | MWA | 1.484 | −15.0 | 0.642 | −21.5 | 6 | 1253 ± 153 |
| 2005 Jan 19 | KL1 | 1.208 | −2.0 | 0.393 | 10.9 | 8 | 2727 ± 114 |
| KL2 | 1.208 | −2.0 | 0.394 | 11.0 | 8 | 2755 ± 132 |
Note. Rh, dRh/dt,
Download table as: ASCIITypeset image
We nodded the telescope along the 24'' long slit in an A1B1B2A2 sequence with 12'' beam separation. The operation (A1 − B1 − B2 + A2) provided cancellation (to second order in air mass) of thermal background emission and of "sky" line emission from the Earth's atmosphere. A slit width of 0 43 resulted in spectral resolving power
The cross-dispersed capability of NIRSPEC permitted sampling of all targeted molecules using two instrument settings in the L band (2.9–4.0
Data reduction, flux calibration (based on observations of a standard star), and spectral extraction were achieved using custom-designed algorithms developed specifically for our comet observations. These algorithms are described in multiple sources, including DiSanti et al. (2006), Villanueva et al. (2009) and references therein. Bonev (2005, Appendix 2) reviews in detail all the important steps leading from data acquisition to flux-calibrated spectra of C/2004 Q2. Wavelength calibration is accomplished by comparing the sky radiance with spectra synthesized using a rigorous line-by-line radiative transfer model of the terrestrial atmosphere (GENLN2; Edwards 1992). This model was recently updated to properly include pressure-shift coefficients and the latest spectroscopic parameters (Villanueva et al. 2008; Hewagama et al. 2003).
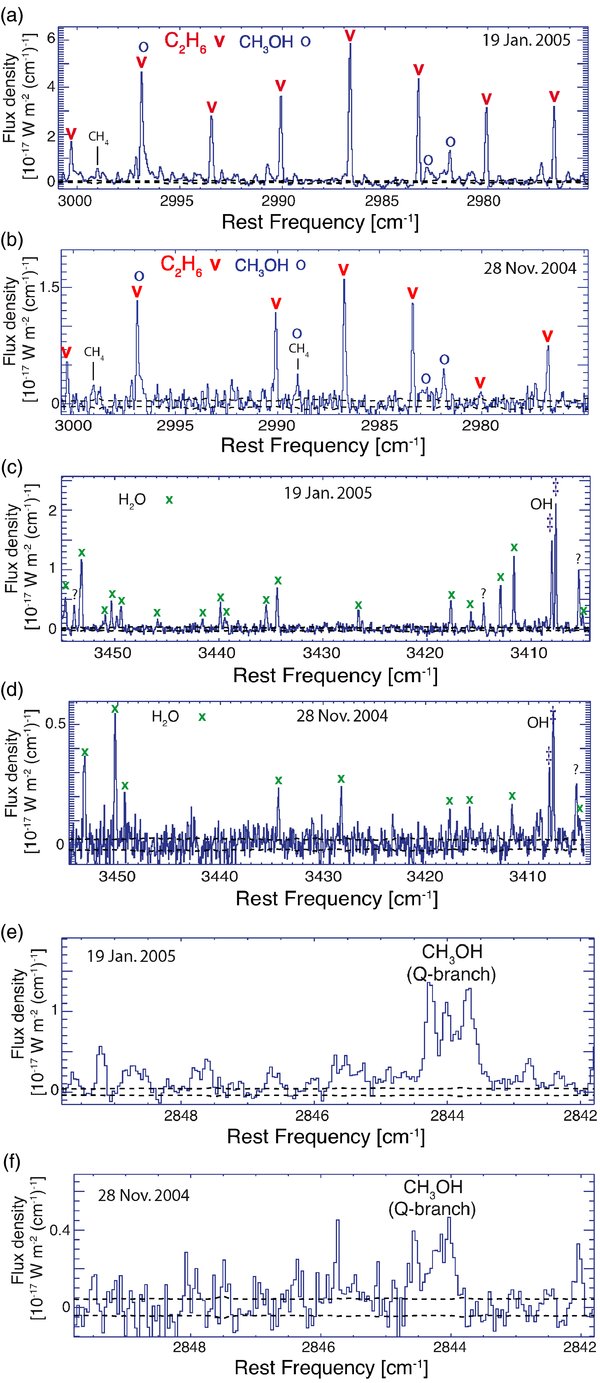
Flux-calibrated spectra of C/2004 Q2 obtained on 2004 November 28–29 and on 2005 January 19 are shown in Figures 1 and 2.9 The January spectra are of especially high quality allowing detection of C2H2 and NH3.
Download figure:
Standard image High-resolution image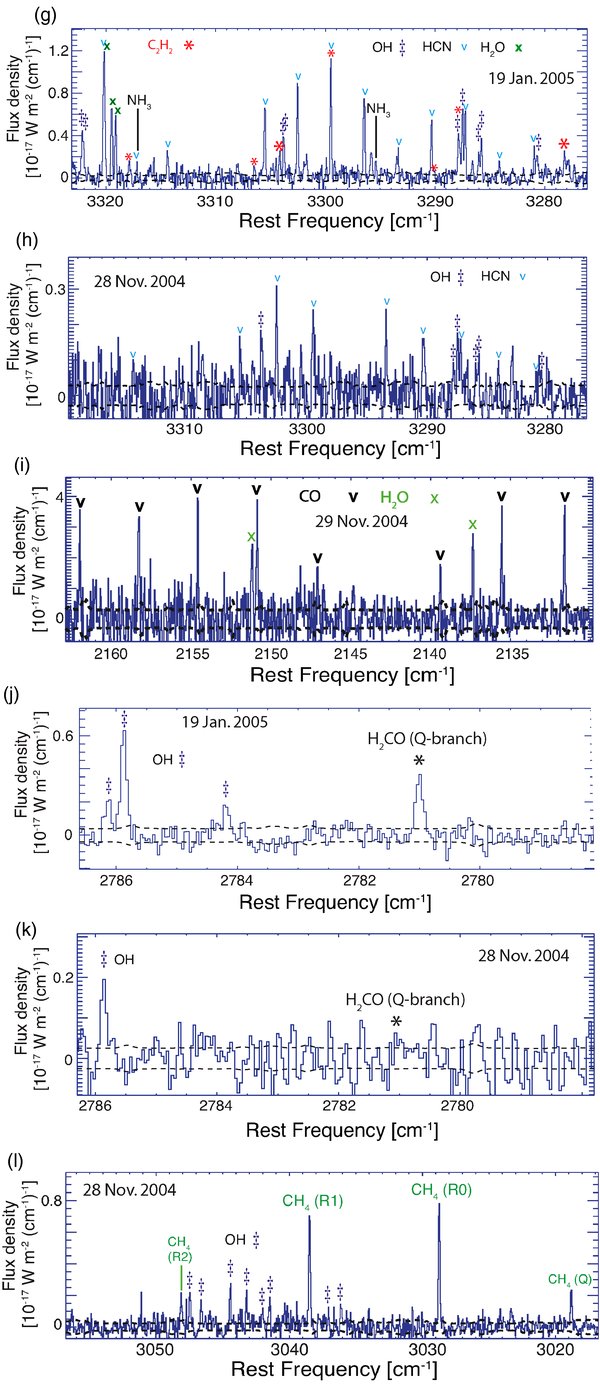
Figure 1. Spectral gallery of C/2004 Q2 (Machholz), showing the (continuum-subtracted) signal within a 0.43 × 1.78 arcsecond aperture centered on the comet. The black dashed lines envelope the photon noise (± 1
Download figure:
Standard image High-resolution image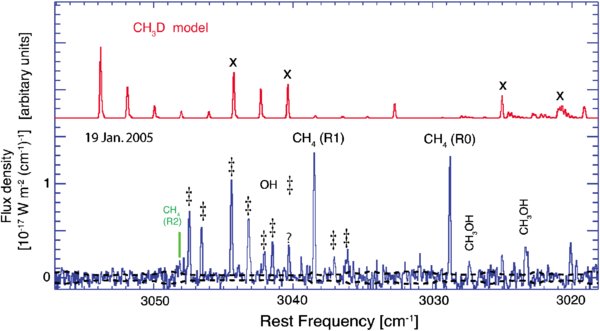
Figure 2. Detection of CH4 and search for CH3D in C/2004 Q2 on 2005 January 19. The lines in the model marked with "x" are excluded from quantitative analysis because of possible spectral contamination by emissions from other species (see text for detailed discussion). The black dashed lines envelope the photon noise (± 1
Download figure:
Standard image High-resolution image3. ORGANIC VOLATILE COMPOSITION
Production rates (Q, molecules s−1) were obtained by comparing the measured line fluxes to predicted fluorescence efficiencies (g factors) for the appropriate rotational temperature (Trot). The g factors are based on quantum-mechanical fluorescence models for H2O (Dello Russo et al. 2004, 2005), C2H6 (Dello Russo et al. 2001), CH4 (Gibb et al. 2003), CH3OH (Reuter 1992; DiSanti et al. 2002), H2CO (DiSanti et al. 2006; Reuter et al. 1989), CO (DiSanti et al. 2001), HCN (Magee-Sauer et al. 1999), C2H2 (Magee-Sauer et al. 2002), and NH3 (Magee-Sauer et al. 2008a)
Multiple lines are used to obtain most production rates, and the level of disagreement between line-by-line production rates is included in the uncertainty. The exceptions are CH3OH and H2CO whose production rates are based on the integrated intensity of the detected Q-branches. The detection of the H2CO Q-branch in the November 28 spectrum is marginal (Figure 1(k)), reflected in the larger error of the resulting production rate.
The production rate of ammonia deserves a special discussion because of possible spectral "contamination" from other species. First, we find no evidence that the emission near 3295 cm−1 labeled NH3 (Figure 1(g)) is contaminated by NH2. Both the measured frequency (3295.4 cm−1) and the line width of this spectral feature are entirely consistent with this emission originating from two blended ammonia lines [aqP(2,0) and aqP(2,1);
Detailed descriptions of the methodology for obtaining rotational temperatures, production rates, and mixing ratios (or their upper limits) are given elsewhere (Villanueva et al. 2009; DiSanti et al. 2006; Bonev et al. 2006, 2007; Dello Russo et al. 2004). Production rates, rotational temperatures, and mixing ratios (relative to H2O) are summarized in Tables 2 and 3. The observed transitions of H2O, HCN, and CO sample quantum levels with a range of rotational energies sufficiently broad to constrain the temperature. We adopted the measured temperatures for water for all other species. Noting that Trot(HCN) and Trot(H2O) differ significantly in January, we verified that the mixing ratio of HCN is only weakly influenced by this difference. We sample enough lines of HCN so that the resulting production rate is relatively insensitive to moderate (within 15–20 K) changes in rotational temperature. As a result, the relative abundance HCN/H2O is nearly the same whether we assume Trot(HCN) = 76 K or Trot(HCN) = 93 K (Table 2).
Table 2. Organic Volatile Composition of Comet C/2004 Q2 (Machholz)
| NIRSPEC Setting | Parent Molecule | Trota (K) | Qb,c (1026 s−1) | Mixing Ratio (%) |
|---|---|---|---|---|
| 2004 Nov 28, Rh = 1.493 |
||||
| KL1 | H2O | (86) | 1535 ± 55 (69) | 100 |
| C2H6 | (86) | 8.62 ± 0.35 | 0.56 ± 0.03 | |
| CH3OH | (86) | 31.11 ± 1.21 | 2.03 ± 0.11 | |
| CH4 | (86) | 19.21 ± 1.65 | 1.25 ± 0.12 | |
| KL2 | H2O | 86 ± 4 | 1435 ± 73 (124) | 100 |
| HCN | 76 ± 9 | 2.02 ± 0.20 | 0.14 ± 0.02 | |
| NH3 | (86) | < 6.81d | < 0.47d | |
| C2H2 | (86) | < 0.91d | < 0.06d | |
| H2CO | (86) | 1.45 ± 0.45 | 0.10 ± 0.03 | |
| CH4 | (86) | 18.08 ± 0.36 | 1.26 ± 0.10 | |
| 2004 Nov 29, Rh = 1.484 |
||||
| MWA | H2O | (100) | 1253 ± 112 (153) | 100 |
| CO | 97+18−17 | 63.46 ± 2.77 | 5.07 ± 0.51 | |
| 2005 Jan 19, Rh = 1.208 |
||||
| KL1 | H2O | (93) | 2727 ± 70 (114) | 100 |
| C2H6 | (93) | 14.89 ± 0.85 | 0.55 ± 0.04 | |
| CH3OH | (93) | 61.97 ± 2.12 | 2.27 ± 0.12 | |
| CH4 | (93) | 39.05 ± 2.41 | 1.43 ± 0.10 | |
| KL2 | H2O | 93 ± 2 | 2755 ± 75 (132) | 100 |
| HCN | 76 ± 2 | 4.12 ± 0.07 | 0.15 ± 0.01 | |
| HCN | (93) | 4.51 ± 0.18 | 0.16 ± 0.01 | |
| NH3 | (76) | 8.26 ± 1.20 | 0.30 ± 0.04 | |
| NH3 | (93) | 10.22 ± 1.48 | 0.37 ± 0.06 | |
| C2H2 | (76) | 2.31 ± 0.12 | 0.08 ± 0.01 | |
| C2H2 | (93) | 2.52 ± 0.13 | 0.09 ± 0.01 | |
| H2CO | (93) | 3.38 ± 0.35 | 0.12 ± 0.02 | |
| CH4 | (93) | 42.50 ± 1.20 | 1.54 ± 0.06 | |
Notes.
aRotational temperature. Values in parenthesis are assumed.
bErrors in production rate include both photon noise and line-by-line deviation between modeled and observed intensities (see Bonev et al. 2007, Dello Russo et al. 2004, Bonev 2005). For Q(H2O), the additional error in parenthesis includes also the uncertainty associated with slit losses caused primarily by atmospheric seeing (see DiSanti et al. 2006, Bonev et al. 2006). Slit losses do not affect mixing ratios among parent species measured within the same NIRSPEC setting, but should be considered in comparison between H2O production rates measured from different settings and/or on different dates.
cSee also Table 4 and Section 4 for methane results on 2005 January 19.
dUpper limits are 3
Download table as: ASCIITypeset image
Table 3. Weighted Mean Mixing Ratios for Species Detected on Both Dates (2004 Nov 28 and 2005 Jan 19)
| Volatile | HCN | CH4 | C2H6 | H2CO | CH3OH |
|---|---|---|---|---|---|
| Mixing ratio X/H2O (%) | 0.15+0.01−0.02 | 1.46 ± 0.08 | 0.56 ± 0.02 | 0.11 ± 0.03 | 2.14 ± 0.12 |
Download table as: ASCIITypeset image
Our water production rate derived for 2005 January 19 agrees within error with the Odin satellite submillimeter measurement (2005 January 20) – Biver et al. (2007) report Q(H2O) = (26.4 ± 0.8) × 1028 s−1. Most importantly, the agreement of our mixing ratios measured at Rh = 1.49
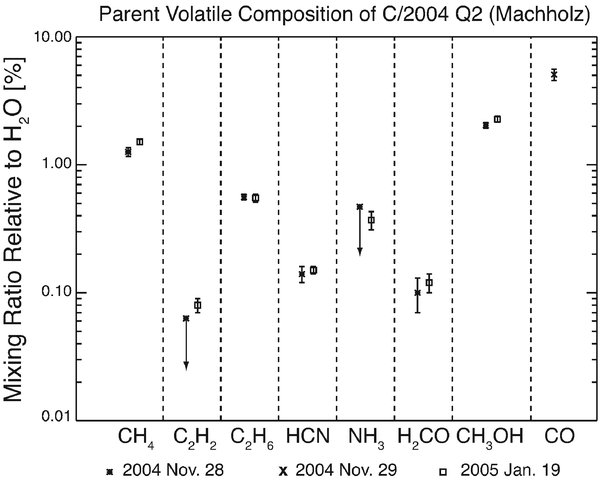
Figure 3. Mixing ratios (relative to H2O) measured in C/2004 Q2 (Machholz). All parent molecules except CO were measured both in 2004 November (Rh = 1.49
Download figure:
Standard image High-resolution image4. AN UPPER LIMIT FOR CH3D/CH4 IN COMET C/2004 Q2 (MACHHOLZ)
Figure 2 shows our detection of CH4 and simultaneous search for CH3D in C/2004 Q2. A production rate for methane is derived from the KL2 setting based on the R0, R1, and R2 lines, and from the KL1 setting, based on the P2 line (see Figure 1(a)). The CH4 production rates are obtained independently for each NIRSPEC setting and agree within error (Table 4).
Table 4. Relative Abundances of CH4 and CH3D in C/2004 Q2 (Machholz) (2005 January 19)
| Mixing Ratio (%) | |||||
|---|---|---|---|---|---|
| NIRSPEC Setting | Isotope | Trot (K) | Q (1026 s−1) | X/CH4 | X/H2O |
| KL1 | CH4 | (93) | 39.05 ± 2.41 | 100 | 1.43 ± 0.10 |
| KL2 | CH4 | (93) | 42.50 ± 1.20 | 100 | 1.54 ± 0.06 |
| KL2 | CH3D | (93) | 0.025 ± 0.284a | < 2.0a | |
Notes. Trot and Q are defined as in Table 2.
aThe error in Q(CH3D) (
Download table as: ASCIITypeset image
In our search for CH3D, we apply the following criterion for molecular detection.
- 1.More than one emission line of the searched molecule must be detected.
- 2.The abundances of the searched volatile, derived independently from each detected line must be in reasonable agreement.
A CH3D fluorescence model (accounting for terrestrial atmospheric transmittance) is shown in Figure 2. This model is adopted from Kawakita & Watanabe (2003). We notice an emission feature close in frequency to the CH3D transition (RR(0,0)) near 3025 cm−1. If we assume that this emission belongs to CH3D, we obtain CH3D/CH4 = 0.3 for the abundance of mono-deuterated methane. However, this value is inconsistent with the nondetections of other sampled transitions (see model Figure 2), and therefore violates both detection criteria (1) and (2). For such a high abundance, the strong CH3D line (RR(3,3)) near 3054 cm−1 is predicted to be of comparable intensity with the lines from the OH "quadruplet" between 3047 and 3043 cm−1 (as shown on the figure). Instead, the nondetection of this line implies that CH3D/CH4 < 0.027 (3
Three factors affect the sensitivity of the resulting upper limit for mono-deuterated methane. First is the photon noise near the expected positions of CH3D lines. This noise is dominated by thermal background emission and by the "sky" line emission from the terrestrial atmosphere (e.g., Figure 1 of Bonev et al. 2006). The second factor is possible frequency overlap by emission from species other than CH3D in the spectrally crowded region near 3.3
The third factor affecting the reported upper limit is the adopted rotational temperature for CH3D. We assumed the same Trot (93 K) for both CH4 and CH3D, equal to that measured for H2O (Table 2). This represents the more conservative choice for deriving an upper limit—assuming lower rotational temperature for CH3D would result in a smaller (more stringent) upper limit for CH3D/CH4, because the g factors of the sampled strong CH3D lines increase with decreasing Trot (see Kawakita & Watanabe 2003).
Kawakita & Kobayashi (2009) published a completely independent investigation focusing on the spin temperatures of water and methane in Q2/Maccholz and on CH3D. They observed the comet on 2005 January 30 with NIRSPEC and accumulated 36 minutes on source (versus 8 minutes in our study). Based on a tentative detection of the RR(3,3) line, this work reports D/H = 0.0038 ± 0.0013 (CH3D/CH4 = 0.0152 ± 0.0052). These authors point out that the detected emission might be attributed to another species (e.g., CH3OH), in which case they conclude that on the 95% confidence level D/H < 0.0064 (CH3D/CH4 < 0.025). These results are in good agreement with our retrieval, thereby increasing the reliability of D/H measured for methane in C/2004 Q2.
Finally, our 3
5. SPIN TEMPERATURE OF METHANE IN C/2004 Q2: CONSTRAINTS AND UNCERTAINTIES
In this section, we describe the constraints on the spin temperature of CH4 that can be imposed by the C/2004 Q2 measured spectra. The CH4 molecule exists in three types of nuclear spin species (A, E, and F; see Barnes et al. 1972). The temperature that reproduces a given A:E:F abundance ratio under conditions of thermal equilibrium is defined as the methane spin temperature (Kawakita et al. 2005, Gibb et al. 2003). This parameter should be distinguished from the rotational temperature defined as the Boltzmann temperature that describes the rotational population distribution within the ground vibrational level for a given spin "ladder". Radiative and collisional transitions among levels from different spin states are strongly forbidden.
5.1. The R0/R1 Line Ratio as a Spin Temperature Diagnostic
The R0 and R1 lines (
Table 5. Relative Fluxes Between the R0 and R1 Lines of CH4 (
| Predicted Flux Ratio (R0/R1) | |||||
|---|---|---|---|---|---|
| UT Date | Measured Flux Ratio (R0/R1) | Model Trot (K) | Statistical Equilibrium | Tspin = 38 K | Tspin = 30 K |
| 65 | 1.239 | 1.290 | 1.401 | ||
| 2004 Nov 28 | 1.126 ± 0.043 | 86 | 1.172 | 1.219 | 1.323 |
| 90 | 1.163 | 1.209 | 1.313 | ||
| 70 | 1.220 | 1.269 | 1.378 | ||
| 2005 Jan 19 | 1.068 ± 0.045 | 93 | 1.157 | 1.203 | 1.307 |
| 110 | 1.128 | 1.173 | 1.275 | ||
Notes. All flux ratios are corrected for telluric transmittance. The CH4 rotational temperature (Trot) cannot be constrained from our spectra and therefore is used as a free parameter. Rotational temperatures of 86 K (November) and 93 K (January) were found for H2O (Table 2).
Download table as: ASCIITypeset image
We found that the R0/R1 line ratio was consistent with spin temperatures higher than 35 K for both dates (2004 November 28 and 2005 January 19). Our January observations rule out Tspin below 38 K at the 99% confidence limit imposed by the 3
We verified that the assumed rotational temperature for methane does not impact our conclusion for Tspin ≳ 35 K. This conclusion holds for a wide range of Trot as shown in Table 5 and Figure 4. Assuming a rotational temperature substantially lower than that found for H2O reduces the agreement between observed and predicted line ratios for any value of the spin temperature. However, the predicted line ratio (R0/R1) for statistical equilibrium still provides the best match to the measurement. Assuming rotational temperatures higher than measured for water strongly favors Tspin ≳ 35 K.

Figure 4. Dependence of the methane R0/R1 flux ratio (CH4,
Download figure:
Standard image High-resolution image
We also verified that the R0/R1 ratio (and respectively Tspin) is insignificantly affected by variation in the telluric transmittance function. The reason is that a change in the telluric transmittance produces a correlated change in the derived top-of-the-atmosphere fluxes of the two methane lines, so their relative intensities are only weakly affected. Finally, similar lower limits for Tspin are found at both blue (2004 November 28) and red (2005 January 19) Doppler shifts also in favor of the measurement's reliability.
5.2. Limitations of the Spin Temperature Retrieval
The main limitations of the derived spin temperature are: (1) it is based on a single line of each spin species sampled (A and F for R0 and R1, respectively) and (2) a common adopted rotational temperature is assigned to each spin ladder. Most CH4 lines are severely extinguished by telluric absorption at the Doppler shifts of our observations (given in Table 1). As a result, only R0 and R1 are detected with high signal to noise, required for a sensitive Tspin measurement.
Even if the Doppler shift was sufficient to obtain high signal to noise for a large number of methane lines, emissions other than R0 and R1 contain lines representing transitions from different spin ladders (Gibb et al. 2003) that remain blended at the spectral resolving power of NIRSPEC. In practice, it is more difficult to derive unique values for Trot(CH4) and Tspin(CH4) from such blended transitions. Robust determination of Trot(CH4) and Tspin(CH4) requires detections of multiple lines of spectrally resolved A-, F-, and E-type transitions that sample quantum states having a broad range of rotational energies. This would allow testing whether the rotational population distributions within a given spin ladder can be characterized by a single rotational temperature and whether the Trot measured independently for the three spin ladders agree. Only then Tspin can be determined more reliably.
Our retrieval does not allow a robust line-by-line test of the CH4 fluorescence model at hand, similar to the way it has been done for H2O (e.g., Dello Russo et al. 2004; Bonev et al. 2007). For this reason, the reported error in Tspin(CH4) does not include a potential model-related uncertainty.
We defer more detailed discussion on problems related to CH4 spin temperature analysis in comets to a separate paper (E. L. Gibb et al. 2009, in preparation). Although potentially less robust, the value derived here for Tspin(CH4) is in very good agreement with the result derived for H2O in C/2004 Q2. Bonev et al. (2007) report Tspin(H2O) > 34 K (this limit is dominated by the systematic uncertainty in line-by-line analysis which exceeds the uncertainty due to photon noise), while Kawakita & Kobayashi (2009) report Tspin(H2O) > 27 K (95% confidence limit, based on
6. DISCUSSION
6.1. Comparison with Organic Volatile Abundances Measured in Other Comets
The abundances of C2H6, CH3OH, and HCN relative to H2O in C/2004 Q2 are similar to those observed in several Oort Cloud comets, tentatively referred to as "organics-normal" (see Mumma et al. 2008, DiSanti & Mumma 2008, Mumma et al. 2003). The abundance of native H2CO is at the lower end of the range observed in Oort Cloud comets (∼0.1%–∼0.8%).
The mixing ratios CO/H2O and CH4/H2O were found to vary by an order of magnitude (or more in the case of CO) among comets (Mumma et al. 2003; Gibb et al. 2003, 2007b). However, there is no correlation between the CO and CH4 abundances. This notion is supported by our observations of Q2/Maccholz where the mixing ratio CO/H2O (≈5%) is intermediate in comparison with other comets (abundances vary between <0.1% and ∼15%), while CH4/H2O (∼1.45%) is near the high end of the observed range (< ∼0.1%–∼2.0%).
Interestingly, acetylene is low in abundance relative to both water and ethane. The C2H6/C2H2 ratio (∼5) in Q2/Machholz is substantially larger than observed in other comets. The relative abundance CH4/HCN (∼10) is also distinctly larger than in previous comets observed (∼2.5 to ∼5.5).
More detailed intercomparison among comets observed in the IR (including C/2004 Q2) will be presented in a future review dedicated to the emerging taxonomic classification of comets based on parent volatile composition (see Mumma et al. 2008 for preliminary results). Here, we focus our discussion on two particular topics: evidence for compositional homogeneity in Q2/Machholz (Section 6.2) and cosmogonic implications of our measured CH3D/CH4 upper limit (Sections 6.3–6.5).
6.2. Compositional Homogeneity of Mean Volatile Release of C/2004 Q2
Infrared measurements of parent volatiles are rarely obtained over a large range of heliocentric distances for a given comet (see Section 3), owing to the difficulty in scheduling adequate observing time. Comets 1P/Halley and C/1995 O1 (Hale-Bopp) are exceptions. Both featured sufficient advance notice to permit planned campaigns. For Halley, water was studied from 1.16
In Hale-Bopp, CO and C2H6 were measured from, respectively, 4.1
- 1.Is the comet nucleus compositionally homogeneous (or heterogeneous) on a bulk scale?
- 2.Are the observed chemical abundances of comet volatiles affected by heliocentric evolution of outgassing?
Several other comets were sampled at IR wavelengths at diverse heliocentric distances. In Comet C/2001 A2 (LINEAR), the H2CO/H2O ratio varied day-to-day by a factor of 4 at 1.16
By contrast, Comet 8P/Tuttle was observed over a range of heliocentric distances (1.16–1.08
The split comet 73P/Schwassmann-Wachmann 3 (73P/SW3) provided the strongest evidence for compositional homogeneity. The mixing ratios of multiple parent volatiles measured in fragments B and C were remarkably similar (heliocentric distances 1.06–0.99
The mixing ratios of parent volatiles in C/2004 Q2 measured at heliocentric distance of 1.5
Our results support chemical homogeneity in the mean volatile release from C/2004 Q2, but do not exclude the possibility that the nucleus has more than one active region (perhaps many) as suggested by studies of daughter fragments (Farnham et al. 2007; Lin et al. 2007). Even if different active regions are characterized by distinct mixing ratios among volatiles, the "mean" release exhibits nearly identical chemistry suggesting that roughly the same proportions of release are maintained. Such compositional similarities for a given comet strongly suggest that the heliocentric evolution of outgassing (whether gradual, e.g., 8P/Tuttle and Q2/Machholz, or abrupt, from outburst or splitting as in 73P/SW3) has not affected the observed abundances. The most plausible hypothesis is that these abundances are representative of the bulk volatile composition and reflect the early history of cometary ices.
6.3. The D/H Ratio in Methane as a Cosmogonic "Thermometer"
Searches for deuterated species are a key part in testing the "interstellar-comet connection" (Charnley & Rodgers 2008a, 2008b). In particular,
- 1.What is the processing history experienced by interstellar organic matter as it is incorporated into the disk of a (low mass) protostar?
- 2.How (and to what extent) is the deuterium fraction modified (with respect insterstellar values) prior to incorporation of ices in cometary nuclei?
- 3.Does "unprocessed" (without change in isotopic signatures) interstellar volatile material exist in comets?
Models that incorporate gas phase chemistry and trace the evolution of D/H from cold (10 K) molecular cloud, through core collapse, to formation of protoplanetary disk predict CH3D/CH4 ≥ 0.10 (Aikawa & Herbst 1999, 2001; see also the nice discussion in Kawakita et al. 2005). On the other hand, our measured upper limit (CH3D/CH4 < 0.02; 3
An important question is whether our measurement can also be explained within the interpretation of Boogert et al. (2004), who detected both gas phase and solid phase CH4 along the line of sight of the massive protostar NGC 7838 IRC 9 and suggested that methane is formed by H-atom addition reactions on grain surfaces and is intimately mixed with water in the protostellar envelope.
Gas-grain chemistry and the effects of three desorption mechanisms (thermal-, photo-, and cosmic ray induced desorption) were incorporated by Willacy (2007), who modeled the chemical evolution in a static (i.e., w/o mixing processes, see Section 6.4) T Tauri disk formed after the collapse of a molecular cloud. This model predicts CH3D/CH4 ratios in the range ∼0.07–0.20. The inconsistency with our upper limit might be related to the initial condition (CH3D/CH4 ≈ 0.07), resulting from methane formation in molecular cloud of temperature equal to 10 K.
These comparisons with chemical models suggest that the methane ice released from the nucleus of Q2/Machholz is not dominated by a component that keeps a chemical "memory" of cold (≪ 25 K) environments in the natal cloud or in the outer regions of the protoplanetary disk (where similar chemistry can occur despite higher densities; see Aikawa & Herbst 2001). The  ratio (<2.3 × 10⁻⁴, preliminary result) in C/2004 Q2 (Biver et al. 2005) supports a similar conclusion for water. The spin temperatures of H2O (>34 K, Bonev et al. 2007) and CH4 (>35–38 K, this work) in C/2004 Q2 also support a relatively warm formation environment, providing Tspin is indeed a measure of the chemical formation temperature of the corresponding molecule.
These conclusions are tentative because the current models for evolution of deuterium enrichments in comet volatiles are still under development. One of the principal challenges is to investigate the possibility for nebular (versus interstellar) origin of volatile matter incorporated into comet nuclei.
6.4. The Possibility for Synthesis of Hydrocarbons in the Inner Protoplanetary Disk and Outward Radial Transport of Matter
An alternative pathway that can explain our CH3D/CH4 upper limit involves hydrocarbons that formed in the inner nebula. Based on laboratory simulations, Nuth et al. (2000) predicted that hydrogenated species can be synthesized along with crystalline dust in the hot environments of the inner solar nebula. Recent laboratory work (Nuth et al. 2008) demonstrated that an organics-rich macromolecular coating forms on various grain surfaces via reactions that reduce CO to produce hydrocarbons. In this process molecules, like CH4 and C2H6 are released in the gas phase, while forming layers of carbon-rich macromolecular residue further providing a catalytic surface for continuing efficient synthesis of organic material. A similar process could produce hydrocarbons efficiently in the hot inner protoplanetary disk.
Outward radial transport of matter could bring these products of high-temperature chemistry to environments where ices can form. Several models (Dubrulle 1993, Drouart et al. 1999, Shu et al. 2001, Bockelee-Morvan et al. 2002, Gail 2002) explored mechanisms for radial mixing in the nebula, and predicted "grand-scale" transport of dust and gas within the nebular disk allowing high-temperature chemical products to be ultimately incorporated into comet nuclei. These predictions were resoundingly confirmed by analysis of refractory minerals in 81P/Wild 2 returned by the "Stardust" mission (Brownlee et al. 2006, Zolensky et al. 2006).
We expect that material synthesized in the hot inner nebula would be characterized by the protosolar value of D/H. Our observed upper limit for CH3D/CH4 corresponds to D/H (<5 × 10⁻³; 3
- 1.the time-dependent abundances of various hydrocarbons resulting from inner-nebula chemistry,
- 2.the efficiency and distance scale (neither are well-understood at present) of outward radial transport in the protoplanetary disk at a particular time, and
- 3.the conditions in outer ice-forming regions, where comet nuclei could accrete.
Since crystalline dust is also produced in the inner nebula (see review of Wooden 2008), the ratio of crystalline-to-total dust content in C/2004 Q2 would provide an additional constraint on the hypothesis of nebular origin for a fraction of organic material stored in the nucleus of this comet (Drouart et al. 1999). A high fraction of crystalline dust is predicted to correlate with low CO-to-hydrocarbons (e.g., CO/C2H6) and N2/NH3 ratios (Nuth et al. 2000).
6.5. Summary on Constraints from CH3D/CH4
Our upper limit for CH3D/CH4 (<0.020, 3
- 1.Formation of methane in a relatively warm (>25 K) gas via ion–molecule chemistry (consistent with the observed CH3D/CH4 upper limit).
- 2.Formation of methane simultaneously with H2O via H-atom addition reactions on interstellar icy grains in the protosolar envelope.
- 3.Synthesis of methane and other hydrocarbons in the hot inner solar nebular, followed by outward radial transport of matter (characterized by protosolar D/H) to environments where comet nuclei can form.
Evaluating the relative contributions of these pathways and the extent to which each pathway is consistent with both the measured upper limit for CH3D/CH4 and the observed volatile abundances relative to H2O requires further modeling of chemistry including both gas-phase and gas-grain processes in the natal interstellar cloud, during core collapse, and in the protoplanetary disk.
We are grateful to Neil Dello Russo for his thorough reviews that improved the quality of the paper. We thank Hideyo Kawakita for providing an updated CH3D model. We are grateful to the following colleagues for stimulating discussions on various aspects in this work: Yuri Aikawa, Dennis Bodewits, Steven Charnley, Martin Cordiner, Joe Nuth, Diane Wooden, and Charles Woodward. We thank undergraduate student Cara Rahon (Iona College) for assisting in the preliminary reduction of several spectral orders.
Various aspects of this research have been supported by the NASA Planetary Astronomy (grants to PIs Mumma and DiSanti), Planetary Atmospheres (PI, DiSanti), and Astrobiology Programs (PI, Mumma), by the NSF Planetary Astronomy Program (grant to PIs Bonev and Gibb) and by the NSF Planetary Astronomy RUI program (grant to PI Magee-Sauer).
The data presented herein were obtained at the W. M. Keck Observatory, operated as a scientific partnership among CalTech, UCLA, and NASA. This Observatory was made possible by the generous financial support of the W. M. Keck Foundation. The authors wish to recognize and acknowledge the very significant cultural role and reverence that the summit of Mauna Kea has always had within the indigenous Hawaiian community. We are most fortunate to have the opportunity to conduct observations from this mountain.
Footnotes
- 6
"Parent" molecules are those released directly from ices stored in the nucleus ("native" ices).
- 7
Hereafter Q2/Machholz or C/2004 Q2.
- 8
- 9
Selected flux-calibrated spectra in ascii format can be immediately requested from the M. J. M. (Michael J. Mumma@nasa.gov). All flux calibrated spectra will be made available after our on-going investigations on C/2004 Q2 (Machholz) that are not included in this work are complete.
- 10
D/H(methane) = 0.25 × CH3D/CH4.
- 11
In the same model, the region characterized by highest D/H ratios is in the center of the prestellar cloud. Most of this material would likely be absorbed by the forming protostar.
- 12