Abstract
Using decays to \(\phi \)-meson pairs, the inclusive production of charmonium states in \({b} \)-hadron decays is studied with pp collision data corresponding to an integrated luminosity of \(3.0 {\,\mathrm{fb}}^{-1} \), collected by the LHCb experiment at centre-of-mass energies of 7 and 8 TeV. Denoting by \({\mathcal {B}} _C \equiv {\mathcal {B}} ( {{b}} \!\rightarrow C X ) \times {\mathcal {B}} ( C\!\rightarrow \phi \phi )\) the inclusive branching fraction of a \({{b}} \) hadron to a charmonium state C that decays into a pair of \(\phi \) mesons, ratios \(R^{C_1}_{C_2}\equiv {\mathcal {B}} _{C_1} / {\mathcal {B}} _{C_2}\) are determined as \(R^{{\upchi _{{{c}} 0}}}_{{\eta _{{c}}} (1S)} = 0.147 \pm 0.023 \pm 0.011\), \(R^{{\upchi _{{{c}} 1}}}_{{\eta _{{c}}} (1S)} = 0.073 \pm 0.016 \pm 0.006\), \(R^{{\upchi _{{{c}} 2}}}_{{\eta _{{c}}} (1S)} = 0.081 \pm 0.013 \pm 0.005\), \(R^{{\upchi _{{{c}} 1}}}_{{\upchi _{{{c}} 0}}} = 0.50 \pm 0.11 \pm 0.01\), \(R^{{\upchi _{{{c}} 2}}}_{{\upchi _{{{c}} 0}}} = 0.56 \pm 0.10 \pm 0.01\) and \(R^{{\eta _{{c}}} (2S)}_{{\eta _{{c}}} (1S)} = 0.040 \pm 0.011 \pm 0.004\). Here and below the first uncertainties are statistical and the second systematic. Upper limits at 90% confidence level for the inclusive production of X(3872), X(3915) and \({\upchi _{{{c}} 2}} (2P)\) states are obtained as \(R^{X(3872)}_{{\upchi _{{{c}} 1}}} < 0.34\), \(R^{X(3915)}_{{\upchi _{{{c}} 0}}} < 0.12\) and \(R^{{\upchi _{{{c}} 2}} (2P)}_{{\upchi _{{{c}} 2}}} < 0.16\). Differential cross-sections as a function of transverse momentum are measured for the \({\eta _{{c}}} (1S)\) and \(\chi _c\) states. The branching fraction of the decay \({{{B}} ^0_{{s}}} \!\rightarrow \phi \phi \phi \) is measured for the first time, \({\mathcal {B}} ( {{{B}} ^0_{{s}}} \!\rightarrow \phi \phi \phi ) = (2.15 \pm 0.54 \pm 0.28 \pm 0.21_{{\mathcal {B}}}) \times 10^{-6}\). Here the third uncertainty is due to the branching fraction of the decay \({{{B}} ^0_{{s}}} \!\rightarrow \phi \phi \), which is used for normalization. No evidence for intermediate resonances is seen. A preferentially transverse \(\phi \) polarization is observed. The measurements allow the determination of the ratio of the branching fractions for the \({\eta _{{c}}} (1S)\) decays to \(\phi \phi \) and \({{p}} {\overline{{{p}}}} \) as \({\mathcal {B}} ( {\eta _{{c}}} (1S)\!\rightarrow \phi \phi )/{\mathcal {B}} ( {\eta _{{c}}} (1S)\!\rightarrow {{p}} {\overline{{{p}}}} ) = 1.79 \pm 0.14\pm 0.32\).
1 Introduction
The production of the \(J^{PC} = 1^{--}\) charmonium states has been extensively studied using decays to clean dilepton final states. Other states such as those from the \(\chi _c\) family can be accessed via the radiative transition to \({{J}/\uppsi }\). Studies of the production of the non-\(1^{--}\) charmonium states can be performed by reconstructing their decays to fully hadronic final states [1]. This paper reports a measurement of the inclusive production rates of the \(\eta _{{c}} \) and \(\chi _c\) states in \({b} \)-hadron decays, \({{b}} \!\rightarrow {\eta _{{c}}} X \) and \({{b}} \!\rightarrow \chi _c X \), using charmonia decays to a pair of \(\phi \) mesons. In addition, the first evidence for the decay \({{{B}} ^0_{{s}}} \!\rightarrow \phi \phi \phi \) is reported.
Results on inclusive charmonium production in \({b} \)-hadron decays are available from \({e} ^+{e} ^-\) experiments operating at centre-of-mass energies around the \({\Upsilon {(4S)}}\) and \({\Upsilon {(5S)}}\) resonances, studying mixtures of \({{{B}} ^+} \) and \({{B}} ^0\) mesonsFootnote 1 (light mixture) or \({{{B}} ^+} \), \({{B}} ^0\) and \({{B}} ^0_{{s}} \) mesons, respectively. Mixtures of all \({b} \)-hadrons (\({{{B}} ^+} \), \({{B}} ^0\), \({{B}} ^0_{{s}} \), \({{B}} _{{c}} ^+\) and \({b} \)-baryons) have been studied at LEP, the Tevatron and the LHC. The world average values for charmonium branching fractions from the light mixture are dominated by results from the CLEO [2, 3], Belle [4] and BaBar [5] collaborations. For the \({{J}/\uppsi }\), \(\uppsi {(2S)}\) and \(\upchi _{{{c}} 1}\) states the measured branching fractions are consistent within uncertainties. The new Belle result for the \({{b}} \!\rightarrow {\upchi _{{{c}} 2}} X \) branching fraction [4], which supersedes the previous measurement [6], is below the BaBar result [5] by more than 2.5 standard deviations, while the CLEO collaboration does not observe a statistically significant \({{b}} \!\rightarrow {\upchi _{{{c}} 2}} X \) signal [3]. An upper limit on the inclusive production rate of \({\eta _{{c}}} (1S)\) mesons in the light mixture, \({\mathcal {B}} ( {{B}} \rightarrow {\eta _{{c}}} (1S) X ) < 9 \times 10^{-3}\) at \(90 \%\) confidence level (CL), was reported by CLEO [7].
The branching fractions of \({b} \)-hadron decays to final states including a \({{J}/\uppsi }\) or \(\uppsi {(2S)}\) charmonium state, where all \({b} \)-hadron species are involved, are known with uncertainties of around 10%, with the world averages dominated by the measurements performed at LEP [8,9,10]. The ratio of \({{b}} \!\rightarrow {\uppsi {(2S)}} X \) and \({{b}} \!\rightarrow {{{J}/\uppsi }} X \) yields has been measured at the LHC by the LHCb, CMS and ATLAS collaborations with a precision of around 5% [11,12,13]. The only available results for the \(\upchi _{c}\) family are the \(\upchi _{{{c}} 1}\) inclusive production rates in \({b} \)-hadron decays measured by the DELPHI and L3 collaborations [8, 9], with an average value of \({\mathcal {B}} ( {{b}} \rightarrow {\upchi _{{{c}} 1}} X) = (14 \pm 4) \times 10^{-3}\) [14]. Recently, LHCb measured the \({\eta _{{c}}} (1S)\) production rate, \({\mathcal {B}} ( {{b}} \rightarrow {\eta _{{c}}} (1S) X) = (4.88 \pm 0.64 \pm 0.29 \pm 0.67_{{\mathcal {B}}}) \times 10^{-3}\), where the third uncertainty is due to uncertainties on the \({{J}/\uppsi }\) inclusive branching fraction from \({b} \)-hadron decays and the branching fractions of the decays of \({{J}/\uppsi }\) and \({\eta _{{c}}} (1S)\) to the \({p} \) \(\overline{{{p}}}\) final state [15].
While experimentally the reconstruction of charmonia from \({b} \)-hadron decays allows an efficient control of combinatorial background with respect to charmonium candidates produced in the \({p} \) \({p} \) collision vertex via hadroproduction or in the decays of heavier resonances (prompt charmonium), inclusive \({b} \)-hadron decays to charmonia are theoretically less clean. Since a description of the strong interaction dynamics in \({b} \)-hadron inclusive decays improves with respect to exclusive decays due to consideration of more final states, and the formation of charmonium proceeds through a short-distance process, a factorization of a \(c\bar{c}\) pair production and its hadronization in a given charmonium state becomes a reasonable assumption [16]. The relative inclusive production of \(\upchi _{c}\) states in \({b} \)-hadron decays provides a clean test of charmonia production models. For example, the colour evaporation model predicts a \({\upchi _{{{c}} 2}}/ {\upchi _{{{c}} 1}} \) production ratio of 5 / 3 [17], while the perturbative QCD-based computation predicts that the V-A current, which is responsible for the \({b} \) decays, forbids the \(\upchi _{{{c}} 2}\) and \(\upchi _{{{c}} 0}\) production at leading order. In the non-relativistic QCD (NRQCD) framework [18,19,20], the colour-octet contributions have to be included, predicting the rates to be proportional to \((2J + 1)\) for the \({\upchi _{c}} _J\) states. The NRQCD framework can be applied to both prompt charmonium production and secondary production from \({b} \)-hadron decays and the comparison between these two production mechanisms can provide a valuable test of this theoretical framework.
In this paper we report the first measurements of inclusive \(\chi _c\) and \({\eta _{{c}}} (2S)\) production rates in \({b} \)-hadron decays using charmonium decays to hadronic final states in the high-multiplicity environment of a hadron collider. Experimentally, charmonium candidates from \({b} \)-hadron decays are distinguished from prompt charmonia by exploiting the \({b} \)-hadron decay time and reconstructing a \({b} \)-hadron (and charmonium) decay vertex well separated from the primary vertex where the \({b} \)-hadron candidate was produced. The charmonium states are reconstructed via their decays to a \(\phi \phi \) final state. The \({\eta _{{c}}} (1S)\) production followed by the decay \({\eta _{{c}}} (1S) \rightarrow \phi \phi \) is used for normalization, so that systematic uncertainties partially cancel in the ratios. As a by-product of the production rate measurements, the masses of the \({\eta _{{c}}} (1S)\), \(\upchi _{{{c}} 0}\), \(\upchi _{{{c}} 1}\), \(\upchi _{{{c}} 2}\) and \({\eta _{{c}}} (2S)\) charmonium states and the natural width of the \({\eta _{{c}}} (1S)\) meson are determined.
The \({{B}} ^0_{{s}} \) decay to the \(\phi \phi \) final state has been observed by the CDF collaboration [21] and recently precisely measured by the LHCb collaboration [22], where it was also used to search for \(C\!P\)-violating asymmetries [23]. In the Standard Model (SM) the amplitude for the decay \({{{B}} ^0_{{s}}} \rightarrow \phi \phi \) is dominated by a loop diagram. Experimental verification of the partial width, polarization amplitudes and triple-product asymmetries of the \({{{B}} ^0_{{s}}} \rightarrow \phi \phi \) decay probes the QCD contribution to the weak processes described by nonfactorizable penguin diagrams [24, 25], and contributions from particles beyond the SM to the penguin loops [26,27,28,29,30]. A three-body \({{{B}} ^0_{{s}}} \rightarrow \phi \phi \phi \) decay leads to a final state with six strange quarks. In the SM it is described by the penguin diagram of the \({{{B}} ^0_{{s}}} \rightarrow \phi \phi \) decay with the creation of an additional \({{s}} {\overline{{{s}}}} \) quark pair. The \({{{B}} ^0_{{s}}} \rightarrow \phi \phi \phi \) decay can also receive contributions from an intermediate charmonium state decaying to a \(\phi \phi \) state. Here we report first evidence for the \({{{B}} ^0_{{s}}} \rightarrow \phi \phi \phi \) decay and study its resonance structure. The branching fraction of this decay is determined relative to the branching fraction \({\mathcal {B}} ( {{{B}} ^0_{{s}}} \rightarrow \phi \phi )\) [22]. To cross-check the technique exploited in this paper, the value of \({\mathcal {B}} ( {{{B}} ^0_{{s}}} \rightarrow \phi \phi )\) is also determined relative to the \({\eta _{{c}}} (1S)\) production rate. Finally, the ratio of the branching fractions for the decays \({\eta _{{c}}} (1S) \rightarrow \phi \phi \) and \({\eta _{{c}}} (1S) \rightarrow {{p}} {\overline{{{p}}}} \) is determined, using additional external information.
The LHCb detector and data sample used for the analysis are presented in Sect. 2. Section 3 explains the selection details and the signal extraction technique. Inclusive production of charmonium states in \({b} \)-hadron decays is discussed in Sect. 4. In Sect. 5 measurements of the \({\eta _{{c}}} (1S)\) mass and natural width are described. First evidence for the \({{{B}} ^0_{{s}}} \rightarrow \phi \phi \phi \) decay is reported in Sect. 6. The main results of the paper are summarized in Sect. 7.
2 LHCb detector and data sample
The LHCb detector [31, 32] is a single-arm forward spectrometer covering the pseudorapidity range \(2<\eta <5\), designed for the study of particles containing \({b} \) or \({c} \) quarks. The detector includes a high-precision tracking system consisting of a silicon-strip vertex detector surrounding the pp interaction region, a large-area silicon-strip detector located upstream of a dipole magnet with a bending power of about \(4{\mathrm{\,Tm}}\), and three stations of silicon-strip detectors and straw drift tubes placed downstream of the magnet. The tracking system provides a measurement of momentum, \(p\), of charged particles with a relative uncertainty that varies from 0.5% at low momentumFootnote 2 to 1.0% at 200\({\,\mathrm{GeV}}\). The minimum distance of a track to a primary vertex (PV), the impact parameter (IP), is measured with a resolution of \((15+29/p_{\mathrm{T}}){\,\upmu \mathrm{m}} \), where \(p_{\mathrm{T}}\) is the component of the momentum transverse to the beam, in \({\,\mathrm{GeV}}\). Different types of charged hadrons are distinguished using information from two ring-imaging Cherenkov detectors. Photons, electrons and hadrons are identified by a calorimeter system consisting of scintillating-pad and preshower detectors, an electromagnetic calorimeter and a hadronic calorimeter. Muons are identified by a system composed of alternating layers of iron and multiwire proportional chambers. The online event selection is performed by a trigger, which consists of a hardware stage, based on information from the calorimeter and muon systems, followed by a software stage, which applies a full event reconstruction.
The analysis is based on \({p} \) \({p} \) collision data recorded by the LHCb experiment at a centre-of-mass energy \(\sqrt{s} = 7 {~\mathrm{TeV}}\), corresponding to an integrated luminosity of \(1.0 {\,\mathrm{fb}}^{-1} \), and at \(\sqrt{s} = 8 {~\mathrm{TeV}}\), corresponding to an integrated luminosity of \(2.0 {\,\mathrm{fb}}^{-1} \). Events enriched in signal decays are selected by the hardware trigger, based on the presence of a single deposit of high transverse energy in the calorimeter. The subsequent software trigger selects events with displaced vertices formed by charged particles having a good track-fit quality, transverse momentum larger than 0.5\({\,\mathrm{GeV}}\), and that are incompatible with originating from any PV [23]. Charged kaon candidates are identified using the information from the Cherenkov and tracking detectors. Two oppositely charged kaon candidates having an invariant mass within \(\pm 11 {\,\mathrm{MeV}} \) of the known mass of the \(\phi \) meson are required to form a good quality vertex.
Precise mass measurements require a momentum-scale calibration. The procedure [33] uses \({{{J}/\uppsi }} \rightarrow {\upmu ^+} {\upmu ^-} \) decays to cross-calibrate a relative momentum scale between different data-taking periods. The absolute scale is determined using \({{{{B}} ^+}} \rightarrow {{{J}/\uppsi }} {{\mathrm{K}} ^+} \) decays with known particle masses as input [14]. The final calibration is checked with a variety of fully reconstructed quarkonium, \({{{B}} ^+} \) and \({\mathrm{K}} ^0_{\mathrm{S}}\) decays. No residual bias is observed within the experimental resolution.
In the simulation, pp collisions are generated using Pythia [34, 35] with a specific LHCb configuration [36]. Decays of hadronic particles are described by EvtGen [37], in which final-state radiation is generated using Photos [38]. The interaction of the generated particles with the detector material and its response are implemented using the Geant4 toolkit [39, 40] as described in Ref. [41]. Simulated samples of \({\eta _{{c}}} \) and \(\chi _c\) mesons decaying to the \(\phi \phi \) final state, and \({{B}} ^0_{{s}} \) decaying to two and three \(\phi \) mesons, are used to estimate efficiency ratios and to evaluate systematic uncertainties. Charmonium and \({{{B}} ^0_{{s}}} \rightarrow \phi \phi \phi \) decays are generated with uniform phase-space density, while \({{{B}} ^0_{{s}}} \rightarrow \phi \phi \) decays are generated according to the amplitudes from Ref. [21].
3 Selection criteria and signal extraction
The signal selection is largely performed at the trigger level. The offline analysis selects combinations of two or three \(\phi \) candidates that are required to form a good-quality common vertex displaced from the primary vertex. A good separation between the two vertices (\(\chi ^2 > 100\)) is required, reducing the contribution from charmonia produced directly at the primary vertex to below \(1 \%\). Pairs of \(\phi \) mesons originating from different \({b} \)-hadrons produced in the same beam crossing event are suppressed by the requirement of a good-quality common vertex. Detector acceptance and selection requirements, and in particular the requirement of the kaon \(p_{\mathrm{T}}\) to exceed 0.5\({\,\mathrm{GeV}}\), significantly suppress \(\phi \phi \) combinations with \(p_{\mathrm{T}}\) below \(4{\,\mathrm{GeV}} \).
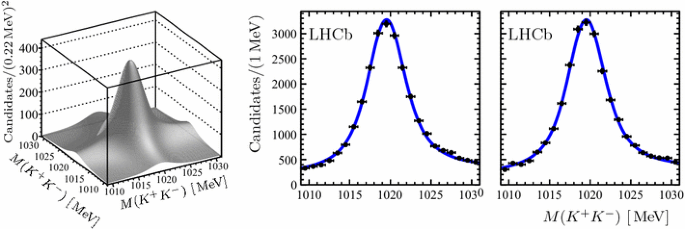
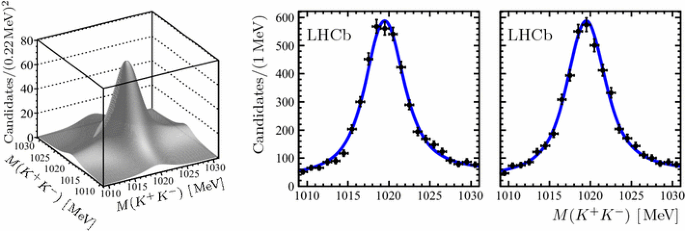
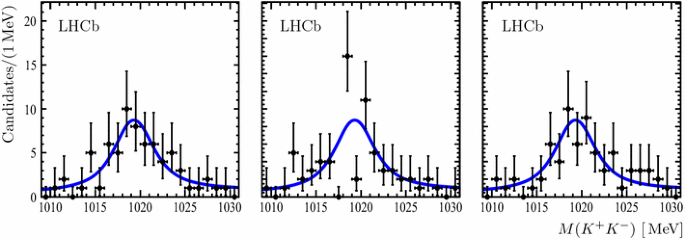
Two-dimensional (2D) or three-dimensional (3D) extended unbinned maximum likelihood fits, corresponding to the two or three randomly ordered \(K^+ K^-\) combinations, are performed in bins of the invariant mass of the four-kaon and six-kaon combinations, denoted as \(2 ( K^+ K^- )\) or \(3 ( K^+ K^- )\), respectively, to determine the numbers of \(\phi \phi \) and \(\phi \phi \phi \) combinations. The 2D fit accounts for the signal, \(\phi \phi \), and background, \(\phi \, ( K^+ K^- )\) and \(2 ( K^+ K^- )\), components, while the 3D fit accounts for the signal, \(\phi \phi \phi \), and background, \(\phi \phi \, ( K^+ K^- )\), \(\phi \, 2( K^+ K^- )\) and \(3 ( K^+ K^- )\), components. A \(\phi \) signal is described by the convolution of a Breit–Wigner function and a sum of two Gaussian functions with a common mean. The ratio of the two Gaussian widths and the fraction of the narrower Gaussian are taken from simulation. The contribution from combinatorial background, due to \({{\mathrm{K}} ^+} {{\mathrm{K}} ^-} \) pairs not originating from the decay of a \(\phi \) meson, is assumed to be flat. In addition, a threshold function to account for the available phase-space in the \({{\mathrm{K}} ^+} {{\mathrm{K}} ^-} \) system is introduced for both signal and combinatorial background. While no visible contribution from the \(f_0 (980)\) resonance decaying into a \(K^+ K^-\) pair is observed in the \(2 ( K^+ K^- )\) or \(3 ( K^+ K^- )\) combinations, a potential effect due to contributions from such decays is considered as a source of systematic uncertainty. Figures 1 and 2 show the results of the 2D fits to the \(2 ( K^+ K^- )\) invariant mass distributions along with the projections to the \({{\mathrm{K}} ^+} {{\mathrm{K}} ^-} \) invariant mass axes in the \({\eta _{{c}}} (1S)\) and \({{B}} ^0_{{s}} \) signal regions, \(2.91 - 3.06 {\,\mathrm{GeV}} \) and \(5.30 - 5.43 {\,\mathrm{GeV}} \). Figure 3 shows the projections to the \({{\mathrm{K}} ^+} {{\mathrm{K}} ^-} \) invariant mass axes of the 3D fit to the \(3 ( K^+ K^- )\) invariant mass distribution in the \({{B}} ^0_{{s}} \) signal region. While using the known value for the natural width of the \(\phi \) resonance [14], the \(\phi \) mass and the remaining resolution parameter are determined from the fits in the enlarged signal \(\phi \phi \) and \(\phi \phi \phi \) invariant mass regions. In the 2D and 3D fits in the bins of \(\phi \phi \) and \(\phi \phi \phi \) invariant mass the \(\phi \) mass and the resolution parameter are then fixed to the values determined in the enlarged signal regions.
Unless they are extracted from the 2D or 3D fits, throughout the paper the error bars shown in the histograms are determined as follows: the upper (lower) error bar assigned to a given bin content N is defined by the expectation value \(\lambda \) of the Poissonian distribution giving 16% probability to observe the number of events N or less (more). When obtained from the 2D or 3D fits the histogram bin contents are constrained to be positive, with error bars defined by the range in the allowed region where the best fit negative-log likelihood value is within half a unit from the global minimum.
In the following, production ratios are determined from the signal yields obtained from the fits of the \(\phi \phi \) or \(\phi \phi \phi \) invariant mass spectra. The relative efficiencies are taken into account to determine the ratio of the branching fractions of the corresponding decays. Signal yields corresponding to the data samples accumulated at \(\sqrt{s} = 7\) and \(8 {~\mathrm{TeV}}\) are found to be compatible. Unless otherwise specified, the results below are based on the analysis of the combined data sample.
4 Charmonium production in decays to \(\varvec{\phi \phi }\)
4.1 Charmonium yields
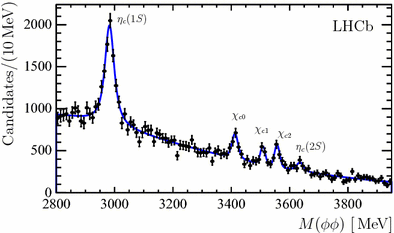
Figure 4 shows the invariant mass spectrum of the \(\phi \phi \) combinations, where the content of each bin is a result of a 2D fit to the two \({{\mathrm{K}} ^+} {{\mathrm{K}} ^-} \) invariant-mass combinations. A binned \(\chi ^2\) fit to the spectrum is used to determine the contributions from the \({\eta _{{c}}} (1S)\) and \({\eta _{{c}}} (2S)\) mesons, and the \(\upchi _{{{c}} 0}\), \(\upchi _{{{c}} 1}\) and \(\upchi _{{{c}} 2}\) mesons. The charmonium-like states X(3872), X(3915) and \({\upchi _{{{c}} 2}} (2P)\) with masses and natural widths from Ref. [14] are taken into account in alternative fits in order to evaluate systematic uncertainties, as well as to obtain upper limits on the inclusive production of these states in \({b} \)-hadron decays. Each resonance is described by the convolution of a relativistic Breit–Wigner function and a sum of two Gaussian functions with a common mean. The combinatorial background, i.e. contributions due to random combinations of two true \(\phi \) mesons, is described by the product of a first-order polynomial with an exponential function and a threshold factor. The natural width of the \({\eta _{{c}}} (1S)\) state is a free parameter in the fit, while the natural widths of the \({\eta _{{c}}} (2S)\) and the \(\chi _c\) states, which have lower signal yields, are fixed to their known values [14]. Possible variations of the \({\eta _{{c}}} (2S)\) production rate depending on its natural width, \(\Gamma _{{\eta _{{c}}} (2S)}\), are explored by providing the result as a function of the assumed natural width. The ratio of the two Gaussian widths and the fraction of the narrow Gaussian are fixed from the simulation. The mass resolution for different charmonium resonances is scaled according to the energy release, so that a single free parameter in the \(\phi \phi \) invariant mass fit accounts for the detector resolution. This scaling of the mass resolution for different charmonium states has been validated using simulation.
Distribution of the invariant mass of \(\phi \phi \) combinations. The number of candidates in each bin is obtained from the corresponding 2D fit. The peaks corresponding to the \({{c}} {\overline{{{c}}}} \) resonances are marked on the plot. The signal yields are given in Table 1
The signal yields are given in Table 1. The ratios of the resonance yields from the fit are given in Table 2, both for the ratios with respect to the \({\eta _{{c}}} (1S)\) yield and between pairs of \(\upchi _{c}\) states; the systematic uncertainties are discussed below. The statistical significance for the \(N_{{\eta _{{c}}} (2S)}\) signal is estimated from the \(\chi ^2\)-profile to be 3.7 standard deviations.
Systematic uncertainties in the ratios of the charmonium yields are estimated by considering potential contributions from other states, from imperfect modelling of detector resolution, signal resonances and background, and from the 2D fit technique. In order to evaluate the systematic uncertainty related to potential contributions from other states, signal shapes for the X(3872), X(3915), and \({\upchi _{{{c}} 2}} (2P)\) states are included in the fit. Systematic uncertainties related to detector resolution are estimated by fixing the \({\eta _{{c}}} (1S)\) mass resolution to the value determined from the simulation. In addition, systematic uncertainties associated to the impact of the detector resolution on the signal shapes are estimated by comparing the nominal fit results to those obtained using a single instead of a double Gaussian function. An uncertainty associated with the description of the mass resolution of the \(\phi \) meson is estimated by fixing the resolution in the 2D fits to the value determined from simulation. The uncertainty associated with the description using the relativistic Breit–Wigner line shape [42] is estimated by varying the radial parameter of the Blatt–Weisskopf barrier factor [43] between 0.5 and \(3 \, {\,\mathrm{GeV}} ^{-1}\). In order to estimate the uncertainty related to the natural width of the \({\eta _{{c}}} (2S)\) meson, the value of \(\Gamma _{{\eta _{{c}}} (2S)}\) is varied within the uncertainties of the world average [14]. The uncertainty in the description of the \(\chi _c\) signal peaks is estimated by fixing the \(\chi _c\) masses to their known values. A reduced fit range, covering only the \(\chi _c\) and \({\eta _{{c}}} (2S)\) region (\(3.15{-}3.95 {\,\mathrm{GeV}} \)), is used to estimate a systematic uncertainty associated to the choice of the fit range. An alternative background parametrization using a parabolic instead of a linear function is used to estimate the systematic uncertainty due to the choice of the background parametrization. A systematic uncertainty associated to the background parametrization in the 2D fits is estimated by adding slope parameters to the description of the non-\(\phi \) \({{\mathrm{K}} ^+} {{\mathrm{K}} ^-} \) combinations in the \(\phi {{\mathrm{K}} ^+} {{\mathrm{K}} ^-} \) and the \(2 \times ({{\mathrm{K}} ^+} {{\mathrm{K}} ^-})\) components. The effect of a potential contribution from the \(f_0 (980)\) state in the 2D fits is estimated by including the \(f_0 (980)\) contribution following the analysis described in Ref. [44], and varying the \(f_0 (980)\) mass and natural width within the uncertainties quoted in Ref. [14]. Contributions from multiple candidates are below 2% per event and are not considered in the evaluation of systematic uncertainties. The uncertainty related to the momentum-scale calibration is negligible.
The total systematic uncertainty is obtained as the quadratic sum of the individual systematic contributions. The systematic uncertainties are shown in Table 3. The description of the background and the potential contributions from other resonances dominate the total systematic uncertainties. In the yield ratios the systematic uncertainty is smaller than or comparable to the statistical uncertainty.
Complementary cross-checks are performed by comparing the distributions of kinematic variables in simulation and data. The stability of the results is checked by using an alternative binning of the \(\phi \phi \) invariant mass distribution (shifted by half a bin) and by using the weighted signal events from the sPlot [45] instead of the nominal 2D fit technique. The same check is performed for the determination of the masses and widths of the charmonium states. In all cases no significant changes are observed and no additional contributions to the systematic uncertainties are assigned.
4.2 Production of \(\varvec{{\eta _{{c}}}}\) and \(\varvec{\chi _c}\) in \({b} \)-hadron decays
The production ratios of charmonium C with respect to the \({\eta _{{c}}} (1S)\) yield and between pairs of \(\upchi _{c}\) states
are determined to be
where, here and throughout, the first uncertainties are statistical and the second are systematic. The dominant contributions to the systematic uncertainty on the relative \(\chi _c\) production rates arise from accounting for possible other resonances and from uncertainties on the \(\chi _c\) masses [14]. The systematic uncertainties are smaller than the statistical uncertainties, so that the overall uncertainty on the measurements will be reduced with a larger dataset. The systematic uncertainty on the relative production rate of \({\eta _{{c}}} (2S)\) mesons is dominated by possible contributions from other resonances and variation of the \({\eta _{{c}}} (2S)\) natural width.
In the following, the \({\eta _{{c}}} (1S)\) production rate in \({b} \)-hadron decays and the branching fractions of the charmonium decays to \(\phi \phi \) are used to obtain single ratios of charmonium production rates in \({b} \)-hadron decays and the branching fractions of inclusive \({b} \)-hadron transitions to charmonium states. The \({\eta _{{c}}} (1S)\) inclusive production rate in \({b} \)-hadron decays was measured by LHCb as \({\mathcal {B}} ( b \rightarrow {\eta _{{c}}} (1S) X ) = ( 4.88 \pm 0.97 ) \times 10^{-3}\) [15] using decays to \({p} \) \(\overline{{{p}}}\). Branching fractions of the charmonia decays to \(\phi \phi \) from Ref. [14] are used. However, Ref. [14] indicates a possible discrepancy for the \({\mathcal {B}} ( {\eta _{{c}}} (1S) \rightarrow \phi \phi )\) value when comparing a direct determination and a fit including all available measurements. Therefore, an average of the results from Belle [46] and BaBar [47] using \({{{B}} ^+} \) decays to \(\phi \phi {{\mathrm{K}} ^+} \), \({\mathcal {B}} ( {\eta _{{c}}} (1S) \rightarrow \phi \phi ) = ( 3.21 \pm 0.72 ) \times 10^{-3}\), is used below. The uncertainty of this average dominates the majority of the following results in this section, and an improved knowledge of the \({\mathcal {B}} ( {\eta _{{c}}} (1S) \rightarrow \phi \phi )\) is critical to reduce the uncertainties of the derived results. The values \({\mathcal {B}} ( {\upchi _{{{c}} 0}} \rightarrow \phi \phi ) = (7.7 \pm 0.7) \times 10^{-4}\), \({\mathcal {B}} ( {\upchi _{{{c}} 1}} \rightarrow \phi \phi ) = (4.2 \pm 0.5) \times 10^{-4}\), and \({\mathcal {B}} ( {\upchi _{{{c}} 2}} \rightarrow \phi \phi ) = (1.12 \pm 0.10) \times 10^{-3}\), are used for the \(\chi _c\) decays [14]. The relative branching fractions of \({b} \)-hadron inclusive decays into \(\chi _c\) states are then derived to be
where the third uncertainty is due to those on the branching fractions \({\mathcal {B}} ( \chi _c \rightarrow \phi \phi )\). The result for the relative \(\upchi _{{{c}} 1}\) and \(\upchi _{{{c}} 2}\) production in inclusive \({b} \)-hadron decays is close to the values measured in \({{B}} ^0\) and \({{{B}} ^+} \) production [14].
The branching fractions of \({b} \)-hadron decays into \(\chi _c\) states relative to the \({\eta _{{c}}} (1S)\) meson are
where the dominating uncertainty is due to the uncertainty of the branching fractions \({\mathcal {B}} ( {\eta _{{c}}} (1S) \rightarrow \phi \phi )\) and \({\mathcal {B}} ( \chi _c \rightarrow \phi \phi )\). The absolute branching fractions are determined to be
where the third uncertainty is due to the uncertainties on the branching fractions of the \({b} \)-hadron decays to the \({\eta _{{c}}} (1S)\) meson, \({\mathcal {B}} ( {{b}} \rightarrow {\eta _{{c}}} (1S) X )\), and of \({\eta _{{c}}} (1S)\) and \(\chi _c\) decays to \(\phi \phi \). The branching fraction of \({b} \)-hadron decays into \(\upchi _{{{c}} 0}\) is measured for the first time, and is found to be larger than the values predicted in Ref. [18].
Throughout the paper comparisons of the results on the production of charmonium states to theory predictions neglect the fact that the measured branching fractions also contain decays via intermediate higher-mass charmonium resonances, whereas theory calculations consider only direct \({b} \)-hadron transitions to the charmonium state considered. Among the contributions that can be quantified the most sizeable comes from the \(\uppsi {(2S)}\) state decaying to the \(\chi _c\) states. With the branching fraction \({\mathcal {B}} ( {{b}} \!\rightarrow {\uppsi {(2S)}} X )\) recently measured [11] by LHCb the branching fractions \({\mathcal {B}} ( {{b}} \!\rightarrow \chi _c X )\), measured in this paper, are influenced by about \(10 \%\). The branching fractions \({\mathcal {B}} ( {{b}} \!\rightarrow {\upchi _{{{c}} 0}} X )\) and \({\mathcal {B}} ( {{b}} \!\rightarrow {\upchi _{{{c}} 2}} X )\) remain different from the predictions in Ref. [18].
The branching fraction measurement for \({b} \)-hadron decays into \(\upchi _{{{c}} 1}\) is most precise in mixtures of \({{B}} ^0\), \({{{B}} ^+} \), \({{B}} ^0_{{s}} \), \({{B}} _{{c}} ^+\) and \({b} \) baryons. The central value is lower than the central values measured by the DELPHI [8] and L3 [9] experiments at LEP, \(( 11.3 ^{+ 5.8} _{- 5.0} \pm 0.4 ) \times 10^{-3}\) and \(( 19 \pm 7 \pm 1 ) \times 10^{-3}\), respectively. For the measurements with different \({b} \)-hadron content, the LHCb result is consistent with measurements by CLEO [2], Belle [4], and BaBar [5]. Finally, the LHCb result for the inclusive \({b} \)-hadron decays into \(\upchi _{{{c}} 1}\) is consistent with the prediction in Ref. [18].
The branching fraction of \({b} \)-hadron decays into \(\upchi _{{{c}} 2}\) is measured for the first time with a mixture of \({{B}} ^0\), \({{{B}} ^+} \), \({{B}} ^0_{{s}} \), \({{B}} _{{c}} ^+\) and \({b} \)-baryons. The result is consistent with the world average [14] measured with the \({{B}} ^0\) and \({{{B}} ^+} \) mixture, and with individual results from CLEO [3], Belle [4] and BaBar [5]. The value obtained is below the range predicted in Ref. [18].
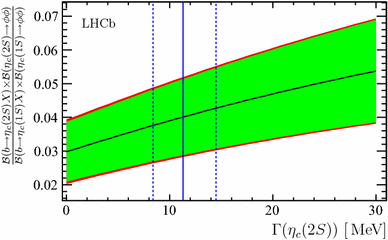
A deviation of the \({\eta _{{c}}} (2S)\) natural width from the world average value [14] would affect the measured ratio of \({\eta _{{c}}} (2S)\) and \({\eta _{{c}}} (1S)\) production rates in \({b} \)-hadron inclusive decays, as shown in Fig. 5. The decay \({\eta _{{c}}} (2S) \rightarrow \phi \phi \) has not been observed so far. Hence the product of the branching fraction of \({b} \)-hadron decays to \({\eta _{{c}}} (2S)\) and the branching fraction of the \({\eta _{{c}}} (2S) \rightarrow \phi \phi \) decay mode is determined as
where the systematic uncertainty is dominated by the uncertainty on the \({\eta _{{c}}} (1S)\) production rate in \({b} \)-hadron decays. This is the first evidence for \({\eta _{{c}}} (2S)\) production in \({b} \)-hadron decays, and for the decay of the \({\eta _{{c}}} (2S)\) meson into a pair of \(\phi \) mesons.
Ratio of the \({\eta _{{c}}} (2S)\) and \({\eta _{{c}}} (1S)\) inclusive yields \(\frac{{\mathcal {B}} ( b \rightarrow {\eta _{{c}}} (2S) X ) \times {\mathcal {B}} ( {\eta _{{c}}} (2S) \rightarrow \phi \phi )}{{\mathcal {B}} ( b \rightarrow {\eta _{{c}}} (1S) X ) \times {\mathcal {B}} ( {\eta _{{c}}} (1S) \rightarrow \phi \phi )}\) as a function of the assumed \({\eta _{{c}}} (2S)\) natural width. Statistical (green band) and total uncertainties are shown separately. The \({\eta _{{c}}} (2S)\) natural width from Ref. [14] is shown as a vertical solid line; the dashed lines indicate its uncertainty
4.3 Transverse momentum dependence of the differential cross-sections for \(\varvec{{\eta _{{c}}} (1S)}\) and \(\varvec{\chi _c}\) production
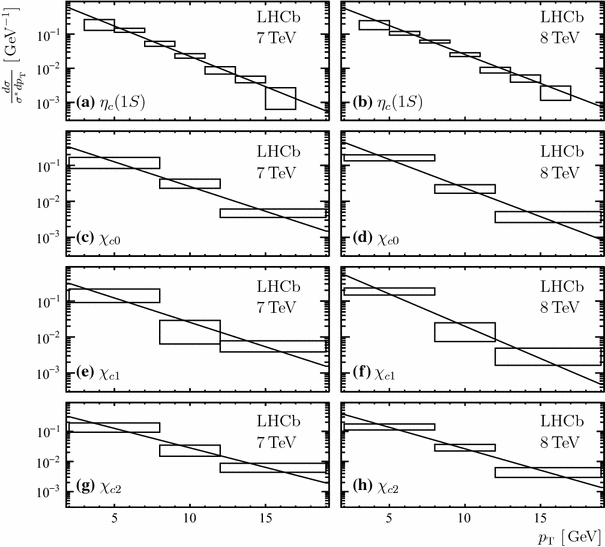
Differential cross-sections normalized to the production cross-section integrated over the studied region, \(\sigma ^*\), of the (top to bottom) \({\eta _{{c}}} (1S)\), \(\upchi _{{{c}} 0}\), \(\upchi _{{{c}} 1}\) and \(\upchi _{{{c}} 2}\) states for the (left) \(\sqrt{s} = 7 {~\mathrm{TeV}}\) and the (right) \(\sqrt{s} = 8 {~\mathrm{TeV}}\) data samples. The horizontal and vertical size of the boxes reflect the size of the \(p_{\mathrm{T}}\) bins and the statistical and uncorrelated systematic uncertainties of the differential production cross-sections added in quadrature. The exponential functions proportional to \(\exp (- \alpha \, p_{\mathrm{T}})\) fitted to the integral of the each bin of the distributions are overlaid
The shapes of the differential production cross-sections as a function of transverse momentum are studied in the LHCb acceptance (\(2< \eta < 5\)) and for \(3< p_{\mathrm{T}} < 17 {\,\mathrm{GeV}} \) and \(2< p_{\mathrm{T}} < 19 {\,\mathrm{GeV}} \) for the \({\eta _{{c}}} (1S)\) and \(\chi _c\) states, respectively. Each differential production cross-section is normalized to the production cross-section integrated over the studied \(p_{\mathrm{T}}\) region. Figure 6 shows the normalized differential cross-sections of \({\eta _{{c}}} (1S)\), \(\upchi _{{{c}} 0}\), \(\upchi _{{{c}} 1}\) and \(\upchi _{{{c}} 2}\) production at \(\sqrt{s} = 7\) and \(8 {~\mathrm{TeV}}\). An exponential function proportional to \(\exp (- \alpha \, p_{\mathrm{T}})\) is fitted to the integral of the each bin of the distributions. No significant difference is observed between the \(\sqrt{s} = 7 {~\mathrm{TeV}}\) and \(8 {~\mathrm{TeV}}\) data. The results for the slope parameters \(\alpha \) are given in Table 4. For \(\upchi _{{{c}} 1}\) and \(\upchi _{{{c}} 2}\) production in \({b} \)-hadron decays these results extend the ATLAS studies [


