


Abstract
For revealing the first step of planet formation, it is important to understand how and when dust grains become larger in a disk around a protostar. To investigate the grain growth, we analyze dust continuum emission toward a disk around the Class I protostar L1489 IRS at 0.9 and 1.3 mm wavelengths obtained by the Atacama Large Millimeter/submillimeter Array. The dust continuum emission extends to a disk radius (r) of r ∼ 300 au, and the spectral index (
Export citation and abstract BibTeX RIS

Original content from this work may be used under the terms of the Creative Commons Attribution 4.0 licence. Any further distribution of this work must maintain attribution to the author(s) and the title of the work, journal citation and DOI.
1. Introduction
The first step of planet formation is suggested to begin by grain growth via coagulation of the initial dust of the interstellar medium (ISM) in a protoplanetary disk. Recent high-resolution observations with Atacama Large Millimeter/submillimeter Array (ALMA) have found multiple gaps and rings in protoplanetary disks at submillimeter wavelengths (ALMA Partnership et al. 2015; Andrews et al. 2018). The presence of large grains (millimeter sized) in protoplanetary disks has been studied by spatially integrated measurements of spectral indices from the submillimeter to centimeter wavelength range with multiwavelength observations (e.g., Tsukagoshi et al. 2016; van Terwisga et al. 2018; Carrasco-González et al. 2019; Macías et al. 2019; Huang et al. 2020; Long et al. 2020; Paneque-Carreño et al. 2021). Furthermore, the existence of planets has been pointed out in several protoplanetary disks (Pinte et al. 2018; Teague et al. 2018; Alves et al. 2020). These results suggest that planet formation may start earlier than classical theories.
Interestingly, dust ring structures are observed not only in Class II protoplanetary disks but also in earlier stages of disk formation around Class 0 and I objects (ALMA Partnership et al. 2015; Segura-Cox et al. 2020; Sheehan et al. 2020; Nakatani et al. 2020). Even though it can be speculated that the ring structures imply grain growth even in the early stage of the protostellar disks, the grain size distribution has been unclear because the dust emission is highly optically thick or only single-band observations have been carried out in the protostellar disks. The measurement of the dust size has been studied toward protostellar disks regardless of substructures via dust continuum emission. Several observations have suggested that the dust grains have already significantly grown at the Class 0/I stage (e.g., Kwon et al. 2009; Zhang et al. 2015; Cieza et al. 2016; Harsono et al. 2018) even though these observations may be affected by the high optical depth. In contrast, recent observations toward a protostellar disk of IRAS 16293–2422 B have suggested that the dust grains may not become larger (amax ≤ 10
An L1489 IRS protostar is located in the Taurus molecular cloud at a distance of 140 pc measured by Gaia (Zucker et al. 2019) and is classified as a Class I protostar (Furlan et al. 2008). A large-scale outflow and surrounding envelope are associated with this protostar (Yen et al. 2014). The conditions of the deeply embedded protostar associated with the outflow represent an early stage of the star-forming process. A Keplerian rotation associated with the L1489 protostar was identified by C18O molecular line observations with a disk radius of 600 au (Brinch et al. 2007; Yen et al. 2013, 2014; Sai et al. 2020). An infalling motion from the envelope toward the Keplerian disk is also identified, indicating that the disk is still growing (Yen et al. 2014). In this paper, we report multifrequency observations of the protostellar disk around L1489 IRS with ALMA to probe the detailed disk structure and investigate dust spectral index.
2. Observations
We have retrieved the archival ALMA observations toward L1489 IRS for the continuum emission at Band 7 (2015.1.01549.S) and Band 6 (2013.1.01086.S). These data are selected because of better sensitivity and spatial resolutions than others. The wavelengths of the continuum emission are 0.9 mm (330 GHz) and 1.3 mm (234 GHz), respectively.
For the 0.9 mm dust continuum emission, the observations were carried out with a configuration of the baseline length from 15.1 to 1124.3 m on 2016 July 26. The maximum recoverable scale ( 1 (corresponding to ∼1000 au), any structures extended more than that size will be resolved out. The phase center was (
 85, 26°18'5630). The on-source times are ∼15 minutes. The calibration of the data was done with CASA 4.5.3. The flux scale is calibrated with J0510+1800 and has an uncertainty of ∼10% (Lundgren 2013). In addition, to improve the sensitivity and image fidelity, self-calibration only for phase was performed. The interval time to solve the complex gain was set to be infinity.
For the 1.3 mm dust continuum emission, the observations were carried out with two configurations: one with the baseline length from 20.6 to 558.2 m on 2015 May 24, and the other extended one with the baseline length from 40.6 to 1507.9 m on 2015 September 20. The maximum recoverable scale (8 (corresponding to ∼1100 au). The phase center during the two tracks was (8, 26°18'5630). The on-source times are ∼23 and ∼25 minutes for the former and latter observations, respectively. The calibration of the data with longer and shorter baselines was done with CASA 4.5.0 and CASA 4.5.2, respectively. The flux scales are calibrated with J0510+180 and J0423–013 and have an uncertainty of ∼10% (Lundgren 2013). In addition, to improve the sensitivity and image fidelity, self-calibration only for phase was performed. The interval time to solve the complex gain was set to be infinity.
The imaging is performed in CASA task tclean with CASA version 5. We construct two images for the Band 7 and Band 6 data: a coarser spatial resolution with better sensitivity and a better spatial resolution with worse sensitivity to investigate the dust thermal emission for a wide range of the spatial scale of the disk structure. For the images with the larger beam size and better sensitivity, the natural weighting with the uv taper of 025 (corresponding to 50 k377 × 0312 with a position angle (PA) of 32° and 0408 × 0344 with a PA of 38° in the 1.3 and 0.9 mm data, respectively. For the images with the smaller beam size, the Briggs weighting with a robust value of 0.5 and with a robust value of −2 was used for the 1.3 and 0.9 mm data, respectively. The synthesized beam sizes result in 0240 × 0158 with a PA of 32° and 0263 × 0176 with a PA of −26° in the 1.3 and 0.9 mm data, respectively.
The spectral index between the 1.3 and 0.9 mm emission is derived in a similar uv range by using CASA task tclean with the multifrequency synthesis (MFS) method (nterm = 2; Rau & Cornwell 2011). We confirmed that the continuum peak positions are consistent between the 1.3 and 0.9 mm images before deriving the spectral index. By applying different uv weightings in the tclean imaging, we obtain two images of the spectral index with the different spatial resolutions and sensitivities. The large-scale image with a better sensitivity is obtained by applying the natural weighting and uv taper of 025 (corresponding to 50 k368 × 0338 with a PA of 19° and 0227 × 0179 with a PA of 19°, respectively.
3. Results
Figures 1(a) and (b) show intensity maps with the larger beam sizes at ALMA Bands 7 and 6, respectively. The rms noise level is 0.18 and 0.077 mJy beam−1, respectively. Both images show disk structure extending over r > 300 au. The total flux densities are 290 ± 12 mJy and 57 ± 1.7 mJy for Bands 7 and 6, respectively, measured by integrating the flux in the disk structure on the image planes.
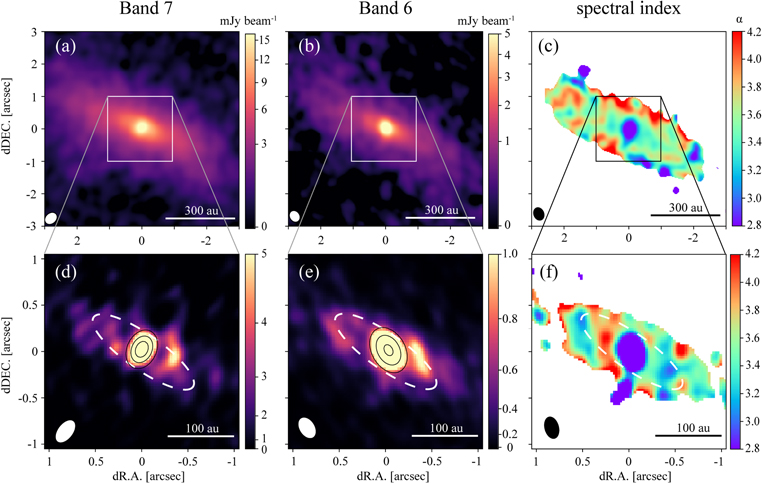
Figure 1. Images of the disk around the L1489 IRS protostar at wavelengths of (a) 0.9 mm and (b) 1.3 mm with the larger beam size and better sensitivity. The rms noise level is 0.18 and 0.077 mJy beam−1, respectively. The spectral index map (panel (c)) is derived by these emissions. Images of the (d) 0.9 mm and (e) 1.3 mm dust continuum emission with the smaller beam size are also shown. Emission from the central position is also shown as the black contours. The contours are 3, 6, and 9 mJy beam−1 in panel (d) and 0.5, 2, and 5 mJy beam−1 in panel (e). The images indicate the ring structure (marked by the white dashed ellipse) in the protostellar disk. The rms noise level is 0.54 and 0.07 mJy beam−1, respectively. The spectral index map is also shown in panel (f). In each panel the resolution is shown by a white or black ellipse in the lower left corner, and a scale bar is in the lower right corner.
Download figure:
Standard image High-resolution imageFigure 1(c) shows a spectral index
We plot the radial profiles of the brightness temperatures of Bands 7 and 6 and that of
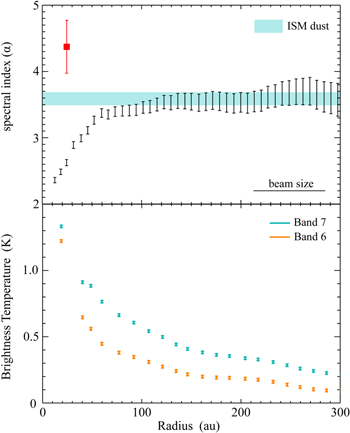
Figure 2. The top panel shows the radial plot of the spectral index
Download figure:
Standard image High-resolution imageThe brightness temperatures of Bands 7 and 6 are as low as ≲1.0 K at r ≳ 100 au, which is much lower than the disk temperature of ∼30 K suggested by Brinch et al. (2007). Such low brightness temperature indicates that the emission is optically thin. This can also be supported by the spectral index being much larger than 2.0.
Figures 1(d) and (e) show the zoomed-in views around the disk center with the smaller beam sizes of Bands 7 and 6, respectively. The rms noise level is 0.54 and 0.07 mJy beam−1, respectively. Even though the beam sizes and sensitivities of these emissions are not enough to reveal the morphology of the disk, both images seem to show ring-like substructure at r ∼ 90 au. The white dashed circles represent the ring structure as a guide to the eye.
To investigate the ring-like substructures in detail, we fit the images of Figures 1(d) and (e) with two components and produce the residual images. The two components are considered to be a central point source and extended disk component. These components are obtained by the 2D Gaussian fitting and subtracted on the image plane. Then, the residual images are expected to remain the disk substructures. Figure 3 shows the images of the observations, the two-component models, and the residuals.
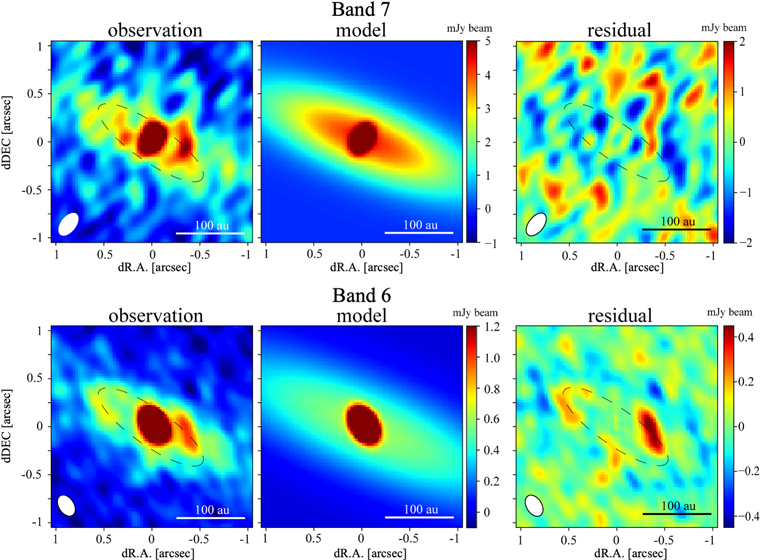
Figure 3. Images of the 0.9 and 1.3 mm dust continuum emission as in Figures 1(d) and (e), but the central components are subtracted. The rms noise level is 0.54 and 0.07 mJy beam−1, respectively. The contours and the beam sizes are the same as in Figures 1(d) and (e), respectively.
Download figure:
Standard image High-resolution imageThe substructure can be recognized in the residual image of the Band 6 data. The peak emission is found with more than 54 west from the protostar. In addition, the emission in the ∼05 east is also found with 3
Note that we cannot identify any substructures in the residual image of the Band 7 data. This is because the sensitivity of the Band 7 data is not enough to identify the substructure emission.
Although the substructure morphology is not conclusive in the Band 7 data, we check the spectral index in the r ≲ 100 au region. Figure 1(f) shows the zoomed-in view of the spatial distribution of the spectral index
Figure 4 shows the radial profiles of the spectral index and the brightness temperatures of Bands 7 and 6, similar to Figure 2. The radial profiles are plotted only toward the northeast direction with a PA of 60° because the opposite side of the southwest direction has weak emission. The substructure seems to be seen at a radius of r ∼ 80–90 au and a width (FWHM) of 80 au, derived by the Gaussian fitting of the radial plot in the Band 6 emission. Note that the width of the ring structure may be overestimated because the Gaussian fitting is performed by including not only the ring but also the extended disk component. The brightness temperatures show as low as 1 K in the 0.9 and 1.3 mm dust continuum emission even in the inner 100 au region, which suggests that the emission is optically thin around the substructure. However, if the ring-like substructure is not resolved, the measured brightness temperature is underestimated and we cannot completely rule out that emission is optically thick.
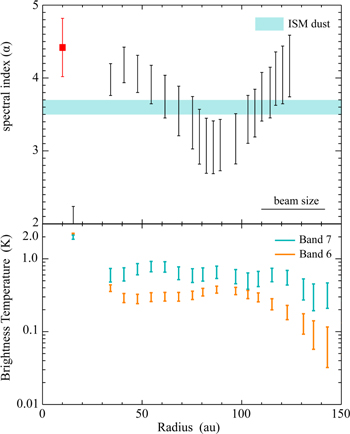
Figure 4. Same radial profiles as Figure 2, but zoomed-in views around the protostar shown in Figures 1(d)–(f). The radial profiles are made toward the northeast direction with a PA of 60°. The 1
Download figure:
Standard image High-resolution imageFigure 4 might imply that the spectral index seems to decrease around r ∼ 90 au with
4. Discussion
4.1. Spectral Index and Grain Size
The spectral index and the intensity are related to the dust temperature (Td), the optical depth (
where h is Planck's constant and kB is Boltzmann's constant (Tsukagoshi et al. 2016). If we use the Rayleigh–Jeans approximation and assume that the optical depth is much lower than unity, Equation (1) becomes

This approximation would work for the L1489 disk because the emission is optically thin. Then, the spectral index
The dust opacity index,
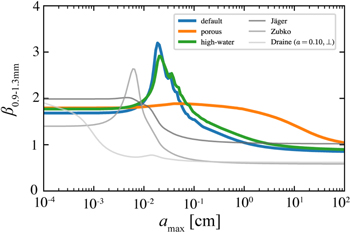
Figure 5. The spectral index in the 0.9–1.3 mm wavelength range with various dust models (Birnstiel et al. 2018).
Download figure:
Standard image High-resolution image
By taking the temperature uncertainty, the spectral index can be expected as
In contrast, Figure 4 might imply that the dust size becomes as large as amax ≳ 1 mm around the substructure of r ∼ 90 au because the spectral index seems to be lower
Note that the spectral index decreases inside the 30 au region. This is probably due to the high optical depth of the continuum emission, which follows the blackbody radiation with
4.2. No Evidence of the Grain Growth but Disk Substructure Formation
Although the disk morphology is not clear, the tentative substructure is found around r ∼ 90 au. If the substructure is real, one possibility of the substructure is a ring because several protostellar disks with the ring-like substructures have been identified (e.g., Alves et al. 2020; Segura-Cox et al. 2020; Sheehan et al. 2020). Various mechanisms for the ring formation have been studied such as a growth front (Ohashi et al. 2021), snowlines of volatile gas species freezing out onto dust grains (Zhang et al. 2015; Okuzumi et al. 2016), magnetorotational instabilities (Flock et al. 2015), disk winds in unevenly ionized disks (Takahashi & Muto 2018), unseen planets (Goldreich & Tremaine 1980; Nelson et al. 2000; Zhu et al. 2012), secular gravitational instability (Takahashi & Inutsuka 2014), and coagulation instability (Tominaga et al.2021).
Our results show that grain growth has not occurred yet outside of the ring-like position. This seems not to be consistent with some ring formation mechanisms that require large dust grains such as the snowline model. In contrast, this result is consistent with the idea of the growth font, where the dust grains are grown by creating the ring structure. The grain growth proceeds in an inside-out manner, and the ring position corresponds to the growth front. Outside of the growth front, the dust particles remain in their initial state because they have not evolved yet, while the dust grains grow inside of the growth front. The location of the growth front (R p ) is estimated as
where M⋆,
If the ring-like structure is caused by the growth front, the disk inside the ring has grains as large as millimeter or even larger, implying the beginning of planet formation. The disk mass is estimated to be ∼0.0071 M⊙ (Sai et al. 2020), which is a typical mass of the Class I protostellar disks (Sheehan & Eisner 2017; Tobin et al. 2020). Therefore, the disk is still massive enough to form planets via accretion from the disk in this early stage (Kobayashi & Tanaka 2021).
Another mechanism of the ring formation is the presence of planets. In this case, planets need to already exist in the Class I stage. Some other mechanisms of the ring formation such as magnetorotational instabilities (e.g., Flock et al. 2015) and disk winds (e.g., Takahashi & Muto 2018) may also work for the ring formation. It is highly needed to make clear the formation mechanism in future studies.
5. Summary
In this paper, we investigated the 0.9 and 1.3 mm dust continuum emission toward the L1489 protostellar disk. The dust continuum emission extends to a disk radius of 300 au, and the spectral index is found to be
We gratefully appreciate the comments from the anonymous referee that significantly improved this article. This paper makes use of the following ALMA data: ADS/JAO.ALMA#2013.1.01086.S, and ALMA#2015.1.01549.S. ALMA is a partnership of ESO (representing its member states), NSF (USA) and NINS (Japan), together with NRC (Canada), MOST and ASIAA (Taiwan), and KASI (Republic of Korea), in cooperation with the Republic of Chile. The Joint ALMA Observatory is operated by ESO, AUI/NRAO and NAOJ. In addition, publications from NA authors must include the standard NRAO acknowledgment: The National Radio Astronomy Observatory is a facility of the National Science Foundation operated under cooperative agreement by Associated Universities, Inc. This work was supported by a pioneering project in RIKEN (Evolution of Matter in the Universe) and JSPS KAKENHI grant Nos. 22H01275, 22H00179, 22H01278, 21K03642, 20K14533, 20H00182, 20H04612, 18H05436, 18H05438, 17H01103, and 17H01105.
Data analysis was in part carried out on the common-use data analysis computer system at the Astronomy Data Center, ADC, of the National Astronomical Observatory of Japan.
Facility: ALMA. -
Software: CASA (McMullin et al. 2007).