


Abstract
We investigate the resolved kinematics of the molecular gas, as traced by the Atacama Large Millimeter/submillimeter Array in CO (2−1), of 25 cluster member galaxies across three different clusters at a redshift of z ∼ 1.6. This is the first large-scale analysis of the molecular gas kinematics of cluster galaxies at this redshift. By separately estimating the rotation curve of the approaching and receding sides of each galaxy via kinematic modeling, we quantify the difference in total circular velocity to characterize the overall kinematic asymmetry of each galaxy. 3/14 of the galaxies in our sample that we are able to model have similar degrees of asymmetry as that observed in galaxies in the field at similar redshift based on observations of mainly ionized gas. However, this leaves 11/14 galaxies in our sample with significantly higher asymmetry, and some of these galaxies have degrees of asymmetry of up to ∼50 times higher than field galaxies observed at similar redshift. Some of these extreme cases also have one-sided tail-like morphology seen in the molecular gas, supporting a scenario of tidal and/or ram pressure interaction. Such stark differences in the kinematic asymmetry in clusters versus the field suggest the evolutionary influence of dense environments, established as being a major driver of galaxy evolution at low redshift, is also active in the high-redshift universe.
Export citation and abstract BibTeX RIS

Original content from this work may be used under the terms of the Creative Commons Attribution 4.0 licence. Any further distribution of this work must maintain attribution to the author(s) and the title of the work, journal citation and DOI.
1. Introduction
It has been shown that the peak of the cosmic star formation rate density happened around ∼10 Gyr ago, at z ∼ 2, (Shapley 2011; Madau & Dickinson 2014). Along with especially high star formation rates, massive (Mstellar ≳ 1010 M⊙) galaxies at this epoch differ from present day galaxies in other significant ways, e.g., the stellar mass–halo mass relation (Behroozi & Silk 2015), the mass–size relation (Perret et al. 2014), and the mass–metallicity relation (Huang et al. 2019). Massive, star-forming galaxies at this redshift also have significantly elevated gas to stellar mass ratios (Tacconi et al. 2010, 2013; Scoville et al. 2017; Tacconi et al. 2018). Furthermore, some high-redshift galaxies in dense environments, i.e., clusters, have been found to have gas mass to stellar mass fractions even higher than field galaxies at the same redshift (Noble et al. 2017; Hayashi et al. 2018; Gómez-Guijarro et al. 2019; Noble et al. 2019; Tadaki et al. 2019). However, other studies have also found populations of high-redshift cluster galaxies with normal gas fractions as predicted from galaxy scaling relations (e.g., Rudnick et al. 2017; Williams et al. 2022), or even depleted molecular gas reservoirs (Alberts et al. 2022), especially in galaxies near the cluster center (Wang et al. 2018; Zavala et al. 2019). See also Alberts & Noble (2022) for a comprehensive review of the state of the field. These diverse results highlight the need for further investigation to better understand the influence of the cluster environment at high redshift.
It has been postulated that high gas fractions in galaxies at this redshift may be the result of environmental effects, such as ram pressure from the cluster environment. A number of galaxies affected by ram pressure observed in the molecular gas phase have shown enhanced molecular gas fractions in either the disk, ram pressure stripped tail, or both, often preferentially on the leading side of the galaxy, i.e., the side experiencing maximum ram pressure (Jáchym et al. 2014; Verdugo et al. 2015; Jáchym et al. 2017; Lee et al. 2017; Moretti et al. 2018; Cramer et al. 2020, 2021). As well as finding elevated gas fractions in a sample of z = 1.6 cluster galaxies, Noble et al. (2019) also found several galaxies with head-tail morphology, and disturbed velocity fields. Along with environmental effects like ram pressure, cluster galaxy morphology and kinematics could also be affected by the elevated tidal interaction rates in clusters when compared to the field (Fried 1988; Byrd & Valtonen 1990; Henriksen & Byrd 1996). Furthermore, a significant fraction of cluster members at redshifts ranging from z = 0–1.5 have been accreted from galaxy groups (McGee et al. 2009), meaning that the effects of high-density environments can affect current cluster members even earlier than their accretion into the cluster—known as preprocessing (Haines et al. 2015; Jaffé et al. 2015, 2016).
One method of studying the effects of the environment on the evolution of galaxies is by studying the kinematic pattern of a galaxy, and quantifying the degree of asymmetry present. This type of analysis is most commonly done in investigating merging versus rotating galaxies, as mergers significantly disrupt the ordered rotation of a galaxy, and increase the velocity dispersion, to such a degree that it can be observed even with relatively low spectral and spatial resolution. There are a number of studies of the multiphase gas and stellar kinematics of merging galaxies at low redshift, both single object (e.g., Combes et al. 1988), and on larger scales such as the SAMI galaxy survey in H
Analysis of kinematic asymmetry in low-redshift galaxies, where high-resolution studies are more easily done, have shown that ram pressure with a significant edge-on wind angle component can lead to a one-sided asymmetry in the ionized gas rotation curve (Boselli et al. 1994; Bösch et al. 2013), and in some cases in the molecular gas rotation curve (Lee et al. 2017; Cramer et al. 2020, 2021). In particular, Bösch et al. (2013) studied the kinematic asymmetry of the ionized gas in a large sample of both cluster and field galaxies at z ∼ 0.17, and found the degree of kinematic distortion in clusters was on average 75% higher than the field sample. The kinematic distortion in clusters was not correlated with stellar body distortion, suggesting cluster effects that affect gas but not stars, like ram pressure, are likely responsible for the elevated degree of kinematic asymmetry. A survey of 46 z ∼ 1.5 galaxy cluster members with KMOS conducted by Böhm et al. (2020) quantified the kinematic asymmetry of the ionized gas rotation curves, and found elevated rates when compared to the low-redshift cluster galaxies from Bösch et al. (2013). However, the data are relatively low resolution. When the data from Bösch et al. (2013) were degraded to the resolution of the observations in Böhm et al. (2020), the signature of kinematic disturbance being due to hydrodynamical effects, as opposed to tidal effects, disappeared. This highlights the need for high-resolution observations in order to understand the environmentally driven evolutionary factors in high-redshift clusters.
High spatial and spectral resolution Atacama Large Millimeter/submillimeter Array (ALMA) studies of the kinematics of molecular gas at high redshift in both cluster and field galaxies are still rare. There is particular value in investigating the molecular gas phase, as the dense molecular gas is the site of star formation. Studying the evolution of the molecular gas phase in the cluster environment can help us to understand the process of galaxy evolution and quenching (Kenney et al. 2004; Vollmer et al. 2012; Boselli et al. 2014; Lee et al. 2017; Cramer et al. 2020, 2021). At present, one of the only larger scale study of well-resolved (and not lensed), high-redshift (z ∼ 1.5) cluster galaxies observed in CO is that of Noble et al. (2019). A survey by Lee et al. (2019) also studied the molecular gas kinematics of 11 galaxies in a protocluster at z ∼ 2.5, but the galaxies were barely resolved, in most cases having only a single beam across each galaxy, so an analysis of kinematic asymmetry and environmental effects would be difficult with this sample. There are high-resolution CO observations of high-redshift galaxies in the field, but they are mostly composed of single-object studies (e.g., Genzel et al. 2013; Spilker et al. 2015; Tadaki et al. 2017; Übler et al. 2018; Molina et al. 2019); small samples (Rivera et al. 2018), including a limited subset from the larger (Genzel et al. 2020) ionized gas sample; or detected gas in lensed galaxies (e.g., Rizzo et al. 2021; Shen et al. 2021), which carries additional uncertainty from the source-plane reconstruction when studying morphological and kinematic properties. A recent study by Ikeda et al. (2022) is based on observations very similar to the sample used in this paper, consisting of resolved observations in CO of 17 cluster galaxies at z = 1.46. It would be interesting, in the future, to conduct a similar study of that sample with the methods presented in this paper.
1.1. Kinematic Asymmetry in High-redshift Field Galaxies
Of all observational high-redshift galaxy studies, the largest sample of quantitatively assessed velocity asymmetry comes from Genzel et al. (2020), investigating mainly ionized gas rotation curves. The authors investigated a sample of 41 rotation curves from a combined sample of observations of galaxies from z = 0.65–2.45, including data from SINFONI, KMOS-VLT, and CO observations from IRAM-NOEMA. Based on an analysis of the rotation curve reflection symmetry about the dynamical center for each galaxy in the sample, Genzel et al. (2020) found no convincing evidence for perturbation or environmental interaction affecting the kinematics for the large majority of the sample. A follow-up by Übler et al. (2021) simulated and mock observed similar galaxies at z = 2 in the TNG50 simulation to those presented in the Genzel et al. (2020) sample, and also measured kinematic asymmetry. Übler et al. (2021) found significantly higher disturbances to a regular velocity field, with a mean degree of asymmetry ∼30 times higher than that measured by Genzel et al. (2020). Übler et al. (2021) suggest that a reason for this huge difference in the degree and rate of kinematic asymmetry in the sample is that half of the simulated galaxies they select have either high accretion rates, or are near massive companions, and could be experiencing tidal effects from close gravitational interaction. These effects are indicated by correlated, large vertical and radial gas motions with respect to the disk plane. Ram pressure stripping from the host galaxy halo may also have an effect, as has been observed in galaxy pairs (Moon et al. 2019). In contrast, only 5/41 galaxies in the Genzel et al. (2020) sample have potentially close companions (
Rates and degrees of tidal interaction, as well as the strength of ram pressure, are significantly higher near the center of dense environments like galaxy clusters. Thus, a study of the kinematic asymmetry in clusters, where the signal is more likely to be strong, could help answer whether effects like ram pressure and gravitational interaction are the cause of the asymmetry difference in the Übler et al. (2021) and Genzel et al. (2020) samples, and establish their role in gas kinematic evolution and observed elevated gas fractions in dense environments.
As such, we present an analysis of the molecular gas kinematics from ALMA observations of three clusters, identified in the Spitzer Adaptation of the Red-Sequence Cluster Survey (SpARCS) fields, at z = 1.6 (Muzzin et al. 2009; Wilson et al. 2009; Demarco et al. 2010). The study we present here is the first of its kind for this gas phase in high-redshift clusters. First, we present the observational data used in this work, including that from the Hubble Space Telescope (HST) and ALMA, in Section 2. In Section 3, we describe our one-sided rotation curve modeling approach for each galaxy comparing the approaching and receding sides. We then quantify the difference in the rotation curve of the two sides, and compare asymmetry rates and magnitudes within these clusters to surveys of high-redshift galaxies in the field. Finally, in Section 4, we discuss the implications of the rates and degrees of asymmetry we find for the larger picture of galaxy evolution as a function of environment at high redshift.
Throughout this work, we assume a galactic
2. Observations
2.1. Optical/Infrared Photometry and Spectroscopy of z ∼ 1.6 SpARCS Clusters
The three clusters of galaxies studied in this paper, J022426032330 (J0224), J033057284300 (J0330), and J022546035517 (J0225), were discovered within the 42 deg2 SpARCS fields (see additional information in Table 1 of Nantais et al. 2016). All three clusters are spectroscopically confirmed with redshifts of z = 1.633, 1.626, and 1.59, respectively (Lidman et al. 2012; Muzzin et al. 2013; Nantais et al. 2016), and contain, in total, 113 spectroscopically confirmed members. In total, there are observations over 16 bands spanning the optical to the near-IR (ugrizYKs
and F160W), as well as IR and far-IR (FIR; 3.6/4.5/5.8/8.0/24/250/350/500
The central cluster regions have deep HST imaging from the "See Change" program (GO-13677 and GO-14327; Hayden et al. 2021) in F160W with the WFC3-IR camera. The HST images shown in this paper are from this filter, and can be found in MAST: 10.17909/yzg9-mj62. The data were reduced using the Drizzlepac software.
2.2. ALMA Observations
The ALMA data used for this project consists of four separate single pointings aimed at the z = 1.6 clusters J0224, J0225, and J0330, combining data from Cycle 5 (2017.1.01228.S, PI: Noble) and Cycle 6 (2018.1.00974.S, PI: Noble). These clusters were observed in Band 3 at 88 GHz to detect the CO(2−1) line with a spatial resolution of ∼0 35. Integrated properties such as gas masses, gas fractions, and depletion times of the galaxies identified in these three clusters were first tabulated in Noble et al. (2017). Utilizing ∼10 × higher spatial resolution and deeper CO data for galaxies within J0225, Noble et al. (2019) additionally presented spatially resolved gas sizes, kinematics, and updated gas masses. The previous work on galaxies in J0224 and J0330 based on the shallower ALMA observations, presented in Noble et al. (2017), only detected a total of three individual galaxies (along with two unresolved pairs of galaxies), compared to the 17 galaxies we detect with the deeper observations for this work. For the three individual galaxies in common, we find slightly higher gas masses, but within ∼1.5
For the three pointings over clusters J0224 and J0330, in addition to the standard full-pass data received from ALMA, we were also able to make use of a subset of semi-pass data. These data were taken during a period of phase discontinuities in several baselines, due to an error with the correlator software. We utilized the baseline phase data to flag data from when the correlator failed. We then concatenated the unflagged semi-pass data with the full-pass data and continued with data reduction.
The data were combined using the CASA software package version 6.1 (McMullin et al. 2007) with the tclean routine using natural weighting to maximize the amount of emission recovered, and a channel width of 50 km s−1. Cleaning was done with the auto-multithresh routine (Kepley et al. 2020), after manual checking of the automatically drawn clean regions, down to a low-noise threshold of 1.535–05, varying slightly between clusters.
Moment maps shown in this paper were generated using the Search routine in 3DBarolo (Teodoro & Fraternali 2015). The routine identifies high threshold peaks (in our case we specified a minimum of 4
3. Analysis
3.1. Kinematic Modeling
We utilized the kinematic modeling software tool 3DBarolo (Teodoro & Fraternali 2015) to ultimately estimate the rotation curve for each galaxy in our sample. 3DBarolo uses a three-dimensional modeling approach to simulate a datacube that minimizes the residual function defined by the input data pixels and a chosen weighting function. The 3D modeling approach allows for rigorous treatment of beam smearing, which is especially important for these types of galaxies, which have sizes of only a few resolution elements, and has been shown to provide accurate estimates of the rotation curve for these types of galaxies (Teodoro & Fraternali 2015). A number of parameters governing the type of model drawn, in our case the centroid, systemic velocity, position angle (P.A.), inclination, circular velocity, and velocity dispersion, can be either fixed, or left to vary as free parameters, optionally guided by an initial guess.
Of the 25 galaxies we detect with ALMA, 16 are strong enough detections (having at least a central CO peak of 4 is greater than the average velocity dispersion
  from the uncertainty in the inclination. Of the nine remaining galaxies we could not fit with 3DBarolo, five were not fit due to being too small (not detected at 2
| Cluster ID | Redshift | CO-detected Galaxies | Rotation Modeled Galaxies |
|---|---|---|---|
| J0224 | 1.63 | 14 | 9 |
| J0225 | 1.59 | 8 | 5 |
| J0330 | 1.63 | 3 | 0 |
Note. Column 1: SpARCS cluster ID, Column 2: spectroscopically determined cluster redshift, Column 3: number of ALMA CO(2−1) detected galaxies in each cluster, and Column 4: of the ALMA detected galaxies, the number of galaxies in each cluster that can be modeled with 3DBarolo. Those that cannot are either dispersion dominated, too small (less than 4 beams across the galaxy), or have too low an S/N (central CO peak below 4
Download table as: ASCIITypeset image
We ran each galaxy through 3DBarolo in a two-step process. In the first run, we left the ring centroid (x0, y0), the systemic velocity, and the P.A. as free parameters. We provided an initial guess for the central ring position of the gas distribution centroid, and an initial guess of the P.A. and the systemic velocity to those that best symmetrized the kinematic pattern. Because the 14 galaxies are rotation dominated, it is possible to provide a relatively accurate estimate of both the P.A. and systemic velocity vsys. We then inspected the model residual patterns for this first run to make sure they exhibited no clear patterns of mismatched centroid, P.A., or vsys (see Warner et al. (1973), van der Kruit & Allen (1978) for examples of these visually identifiable residual patterns). The inclination i of each galaxy was estimated based on a 2D Gaussian fit to the molecular gas distribution, using the imfit routine in CASA. It is very difficult to accurately estimate the inclination of high-redshift galaxies with observations at any wavelength due to the lack of resolution elements across the disk. However, for the purposes of this paper where we are comparing symmetry about the minor axis, and are not concerned with an accurate measurement of the maximum circular rotation of each galaxy, uncertainty in the inclination has no significant impact on our analysis. While the inclination does affect the shape of the tilted rings modeled with 3DBarolo, the uncertainty this would introduce is insignificant when compared to that already present from the beam smearing of the data.
After this first run to constrain the ring geometry, we then did a second run of 3DBarolo with these geometric parameters fixed, and the rotation velocity Vrot and velocity dispersion
This two-step fitting process with 3DBarolo helps ensure a more realistic rotation curve measurement than if the geometric and kinematic parameters were fit at the same time, which tends to lead to more unphysical discontinuities in the rotation field due to oscillations in the inclination and the P.A. (Teodoro & Fraternali 2015; Su et al. 2022). In the second run we also utilize 3DBarolo's built-in method for estimating the uncertainty in the measurement of the rotation velocity and velocity dispersion. This is done after the residual fit function is minimized via a Monte Carlo method. 3DBarolo calculates a range of models centered around this minimum by a series of random Gaussian draws that allow for oversampling this parameter space. The residuals in this region usually behave as a quadratic function, and the errors are estimated as the range where this quadratic function shows a residual increase of 5%. See Teodoro & Fraternali (2015) for more details.
3.2. Measuring Kinematic Asymmetry
In Figure 1, we show an example of the kinematic modeling results for a moment 1 velocity map, and moment 2 velocity dispersion map, displaying our data, the model, and the residual image. The galaxy shown is J0225-371, studied previously as part of the sample analyzed in Noble et al. (2019). The galaxy is relatively well fit by an axisymmetric model, as evidenced by the relatively low residuals, with no clear residual pattern indicative of an incorrect choice for fitting parameters. There is a feature to the SW side of the galaxy that has high velocity dispersion, and a consistent positive residual that may be due to a noncircular motion in the disk from a structure like a spiral arm. A position–velocity diagram (PVD) encompassing all the CO emission oriented along the major axis of this galaxy (see Figure 2) shows the galaxy is relatively symmetric. A model produced by a fit to the approaching side and a model produced by a fit to the receding side have very little discernible difference. In contrast, a galaxy like J0224-424, shown in Figure 3, has an easily visible large difference for a model fit to only the approaching side versus only the receding side (Figure 4). While the difference in the degree of asymmetry between J0225-371 and J0224-424 are clearly visible when inspecting the PVD, we seek a method to quantify the degree of asymmetry of these galaxies. We consider two different methods for this purpose.
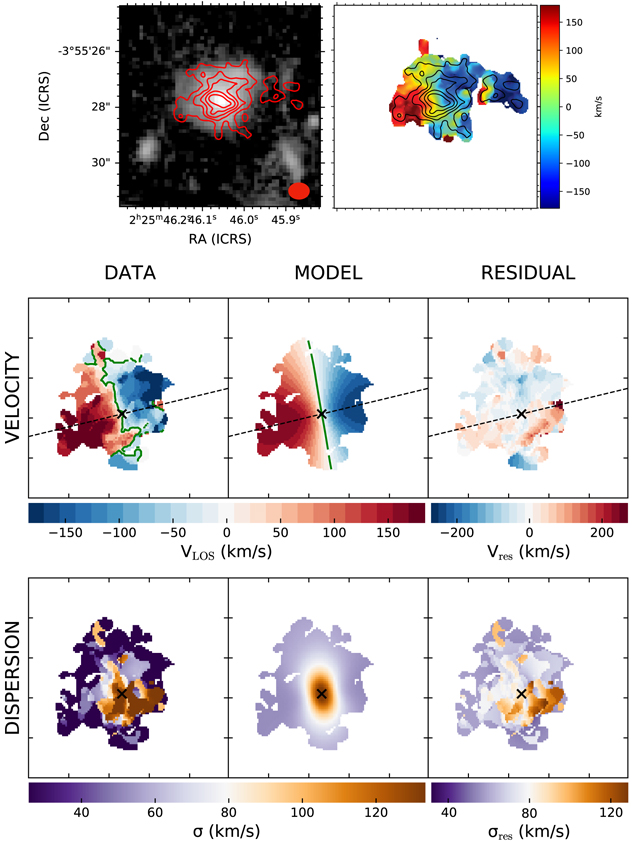
Figure 1. Top: on the left is an HST image of the galaxy J0225-371 in the F160W filter. Overlaid in red contours is the ALMA CO(2−1) moment 0 (intensity) map, with contour levels of 2
Download figure:
Standard image High-resolution image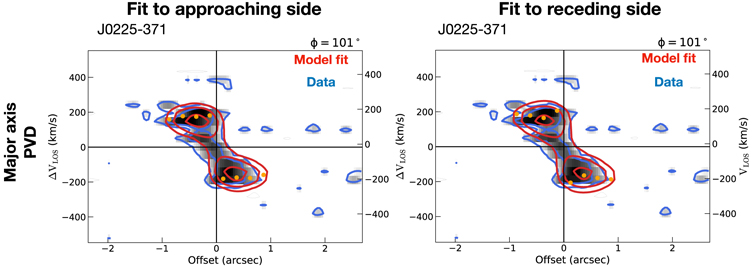
Figure 2. A comparison of the circular velocity fit to the approaching side on the left, and the receding side on the right, of J0225-371. The plots show a PVD encompassing the full span of the galaxy through the major axis. The yellow points show the circular velocity predicted by the modeling with 3DBarolo at each ellipse, spaced by 025. The blue contours show a smoothed version of the data, shown in gray. The red contours show a model fit only to one side of the galaxy. Both contours are shown with levels of 2
Download figure:
Standard image High-resolution image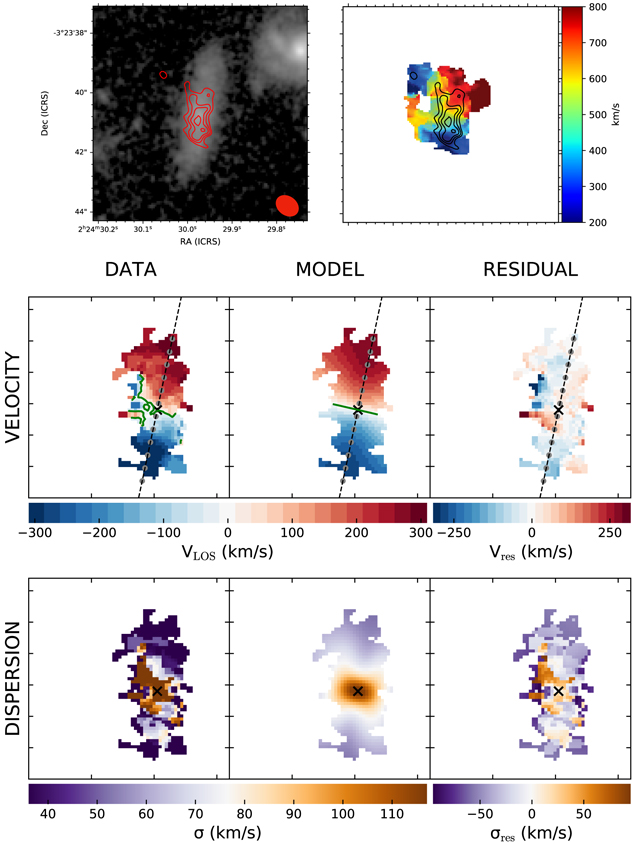
Figure 3. Top: on the left is an HST image of the galaxy J0224-424 in the F160W filter. Overlaid in red contours is the ALMA CO(2−1) moment 0 (intensity) map, with contour levels of 2
Download figure:
Standard image High-resolution image
Figure 4. A comparison of the circular velocity fit to the approaching side on the left, and the receding side on the right, of J0224-424. The plots show a PVD encompassing the full span of the galaxy through the major axis. The yellow points show the circular velocity predicted by the modeling with 3DBarolo at each ellipse, spaced by 025. The blue contours show a smoothed version of the data, shown in gray. The red contours show a model fit only to one side of the galaxy. Both contours are shown with levels of 2
Download figure:
Standard image High-resolution image3.2.1. Asymmetry Quantization
The first method is to simply calculate the sum of the difference in circular velocity of the approaching side (VA) and the receding side (VR) at each ring r. For our sample, these values are estimated by 3DBarolo, and for those in Übler et al. (2021), they are estimated using the DYSMAL software package (Cresci et al. 2009). This is then normalized by the error in the circular velocity
If a galaxy had a perfectly symmetric rotation curve about the minor axis, the difference between points on the approaching and receding sides would be 0. The larger the offset, and the smaller the relative error, the larger the Avel parameter will be. For this method, we normalize each rotation curve such that the maximum velocity is set to 1, so that the highly uncertain inclination estimated from 3DBarolo is not a factor in the calculation. We also calculate Avel for the set of seven simulated galaxies from the Übler et al. (2021) sample. We display the results in Figure 5. The stellar masses for the galaxies in our sample were estimated from spectral energy distribution modeling using CIGALE (Boquien et al. 2019), using the 16 bands spanning the optical to FIR available for SpARCS galaxies. We used the implementation of the Dale et al. (2014) dust model within CIGALE.

Figure 5. Left: a comparison of the stellar mass and the total velocity difference Avel (defined in Equation (1)) measured between the sampled points on the velocity curve of the approaching and receding sides of each galaxy in our sample in the two clusters J0224 and J0225 (green), and the simulated galaxies from Übler et al. (2021; orange). The stellar mass range of the sample from Genzel et al. (2020) is shown in the gray-shaded region. Right: a comparison of the gas fraction (Mgas/(Mgas + M*) and the total velocity difference Avel for both our sample and the simulated sample from Übler et al. (2021). As noted in Noble et al. (2019), the gas fractions of the cluster galaxies in our sample are especially high when compared to those predicted from standard scaling relations. All velocity curves have been normalized to a maximum of 1 to remove any influence from the inclination estimate. The error in Avel is estimated by removing the outermost (which is also the lowest S/N) ring fit by 3DBarolo, and recalculating the asymmetry.
Download figure:
Standard image High-resolution imageTo test whether Avel is correlated with stellar mass, and whether it is correlated with gas fraction, we ran a Spearman rank correlation test on each data sample. Considering only our data on Avel and stellar mass, we find a Spearman correlation value of
We find that overall our sample has a mean Avel of ∼1.1, and a median of ∼0.2, while the Übler et al. (2021) sample has a mean Avel of ∼0.1, and a median of 0.1. On a case-by-case level, about half our sample has a similar range of Avel as the Übler et al. (2021) galaxies. However, as indicated by the very large difference in the mean, several galaxies (preferentially those of low mass) in our sample are much more extremely asymmetric than any in the Übler et al. (2021) sample. We discuss the implications of this further in Section 4. In Figure 6 we show the 14 galaxies in our sample ordered from highest to lowest Avel.
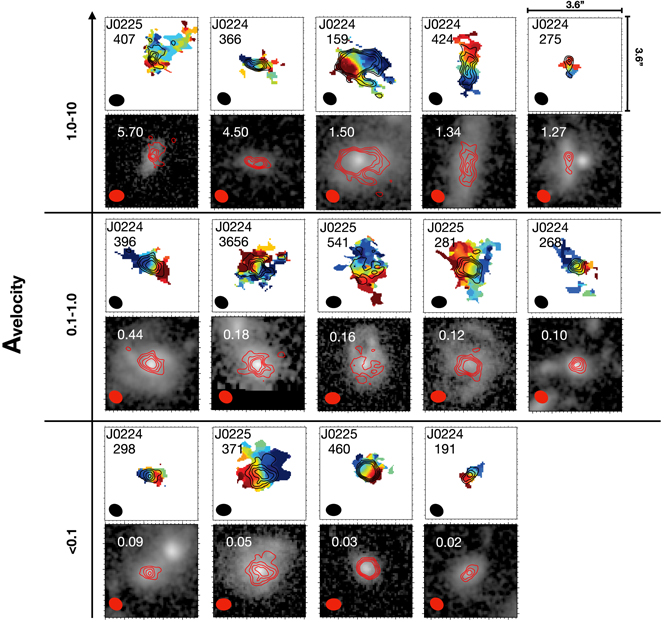
Figure 6. The top figures on each row show moment 1 velocity maps with moment 0 contours in black (contour levels of 26 × 36 (∼30 × 30 kpc). The cluster each galaxy is found in as well as its catalog ID is shown in black text on the moment 1 map. The moment 1 maps shown with color bars can be found in Appendix C. The galaxies are ordered from highest Avel at the top left, to the lowest Avel at the bottom right. The Avel value is printed in white text on the moment 0 and HST overlay cutout. Note that the average Avel of the Übler et al. (2021) sample we compare to in Figure 5 is ∼0.1.
Download figure:
Standard image High-resolution image3.2.2.
 Method for Asymmetry Quantization

We also consider a second method for comparison to the results from this technique used by both Genzel et al. (2020) and Übler et al. (2021). This method involves fitting a parabolic function to the approaching side, and another parabolic function to the receding side, and then comparing that same fit to the opposite side of the galaxy and calculating the difference in the goodness of fit, the reduced chi-squared value, between the two sides as  . This method is useful for smoothing over any discontinuities in the rotation curve which could be due to the uncertainty in the measurement of the rotation velocity, assuming that a smooth rotation curve is a better representation of the true rotation curve. However, this method is of limited use for our sample as only 5/16 galaxies have more than three points on the rotation curve on both the receding and approaching side. At least four points are needed for the number of degrees of freedom to be large enough to calculate a reduced chi squared. We present the results of this chi-squared fitting method for our sample in Figure 7. Overall we find that the
  fit to each single side across the sample has a mean value of ∼1.1, indicating the parabolic fit is a good match to the general velocity trend as a
  value of about one generally indicates. We plot the
  value of each of the five galaxies in our sample, as well as the average
  from the Übler et al. (2021) and Genzel et al. (2020) galaxies in Figure 8.
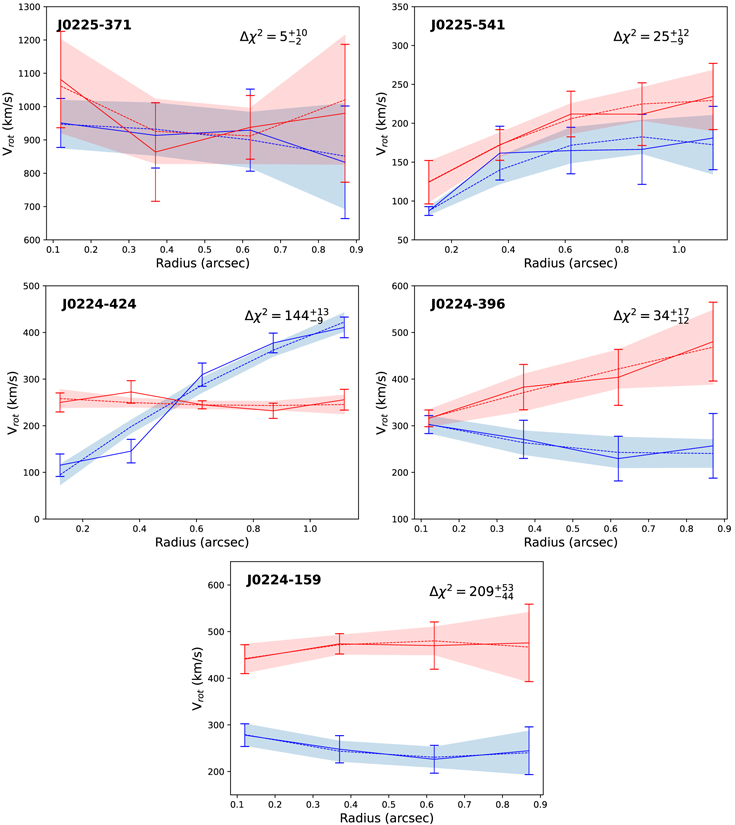
Figure 7. A sample of the rotation curves of the approaching (blue) and receding (red) sides of each galaxy in our sample, showing only galaxies with more than three points on the rotation curve on each side. The solid line shows the rotation velocity estimate at each ring by 3DBarolo. The dotted line is a parabola fit to the data. The shaded regions show the 1 value for comparing each fit to its opposite side. The lower and upper limits on the value of
  are based on recalculating this parameter from the 1
Download figure:
Standard image High-resolution image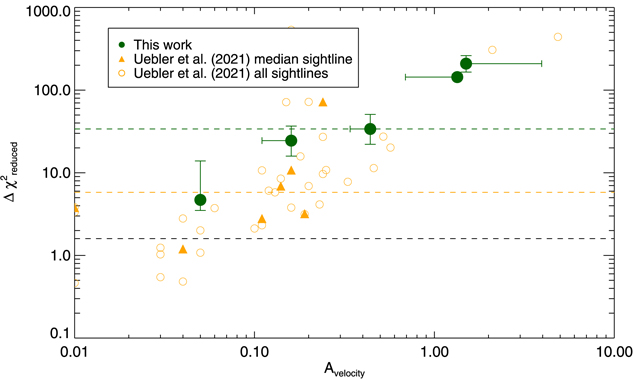
Figure 8. Green denotes the calculated values of the Avel and  parameters for measuring velocity asymmetry described in Section 3.3 for each of the five galaxies in our sample for which it could be measured. Error bars for
  are estimated based on the uncertainty from the curve fitting to the data. The error in Avel is estimated by removing the outermost (which is also the lowest S/N) ring fit by 3DBarolo, and recalculating the asymmetry. The green-dashed line shows the median
  for our sample. The orange points show a comparison between the Avel and
  from Übler et al. (2021). The orange open circles show the five sightlines mock observed for each of the seven galaxies, while the filled triangles show the median value of the five sightlines for each galaxy. Overall, we see a linear trend between Avel and
  . The orange- and black-dotted lines show the median of
  for the galaxies in the Übler et al. (2021) and Genzel et al. (2020) samples, respectively.
Download figure:
Standard image High-resolution imageWe calculate an average and median,  and 34, for our sample of five galaxies. In contrast, Übler et al. (2021) found an average and median value of
  and 5.8, and they also calculated an average value and median of
  and 1.6, for a subset of 12 massive galaxies (M* > 4 × 10¹⁰
M⊙) at z > 1.5 in the Genzel et al. (2020) sample. This indicates that galaxies in our sample are more similar, in terms of the degree of kinematic asymmetry, to the simulated galaxies from Übler et al. (2021), and much more asymmetric than the galaxies in the Genzel et al. (2020) sample.
and 1.6, for a subset of 12 massive galaxies (M* > 4 × 10¹⁰
M⊙) at z > 1.5 in the Genzel et al. (2020) sample. This indicates that galaxies in our sample are more similar, in terms of the degree of kinematic asymmetry, to the simulated galaxies from Übler et al. (2021), and much more asymmetric than the galaxies in the Genzel et al. (2020) sample.
We find there appears to be a linear correlation between Avel and  for galaxies in our sample where both could be calculated (Figure 8), and therefore, extrapolating the Avel comparison to the
  results is supported by this correlation. Given that
  for the Übler et al. (2021) data was so much greater than that for the Genzel et al. (2020) sample, and since the
  we calculate for our restricted sample is even greater than the Übler et al. (2021) sample, we would expect the mean and median Avel for the Genzel et al. (2020) sample to be significantly less than that calculated for our sample and the Übler et al. (2021) sample.
3.3. Caveats
At present, there are a very limited number of studies of galaxy gas kinematic asymmetry. The full parameter space of potential conditions that could affect asymmetry, including redshift and gas phase, is quite unexplored. As such, the closest samples we have with which to compare our sample are observations and simulations of mostly ionized gas rotation curves in field galaxies from z ∼ 1–2 from Genzel et al. (2020) and Übler et al. (2021). Given that our data consist of molecular gas observations of cluster galaxies at redshift z = 1.6, there are many potential sources of systematic uncertainty that could affect this comparison. Here, we address the potential effects of some of these systematics. However, it is clear that we cannot truly understand all the potential sources of uncertainty such as gas phase, redshift, environment, halo mass, etc., without a diversity of further surveys of galaxy kinematics.
3.3.1. Ionized versus Molecular Gas Kinematics
The Genzel et al. (2020) sample is mostly composed of rotation curves derived from observations of ionized gas, and Übler et al. (2021) attempt to simulate a similar gas phase. Thus, our direct comparison of asymmetries in the molecular gas to mainly ionized gas could introduce additional uncertainty. Molecular gas is expected to be dynamically colder than ionized gas, and several studies have shown these two gas phases have different velocity dispersion in low and high-redshift cases (Levy et al. 2018; Übler et al. 2019; Girard et al. 2021). However, there is evidence from the literature that supports that for the purposes of an asymmetry comparison, this may not significantly affect this comparison. Genzel et al. (2013) and Übler et al. (2018) found excellent agreement in the rotation curve derived from H
While it is unknown how much the difference in CO-H
3.3.2. S/N Effects
Another potential concern is whether the asymmetry we measure particularly in the outer regions is majorly biased by the S/N of the observations, as opposed to real gas kinematics. Does the asymmetry calculated with the method described in this work rise as the surface brightness drops toward the outskirts of galaxies? Our analysis supports that this is not likely to be the case. First, while Genzel et al. (2020) do not indicate the S/N limit to which they measure rotation curves, there is no apparent increase in asymmetry toward the ends of the rotation curves they derive (see Figure 4 of Genzel et al. 2020). Furthermore, inspection of a sample of the rotation curves shown in Figure 7 reveals no overall trend toward an increase in asymmetry at the edges of the surface brightness limit of galaxies in our sample. All galaxies in our subset of 14 that we have modeled with 3DBarolo have the peak S/N at the innermost model ring, and drop in S/N toward the outer model rings. As can be seen in Figure 7, galaxy J0224-396 shows an increasing velocity curve from the second ring onward on only one side of the galaxy, a pattern that could be consistent with environmental effects that act from the outside-in more strongly on one side of the galaxy, such as ram pressure stripping (Lee et al. 2017; Cramer et al. 2020). Other galaxies like J0224-424 show a completely different velocity pattern from the inside to the outskirts, not supported by a scenario in which asymmetry increases as S/N decreases.
Finally, for extra assurance, we recalculate the asymmetry for each galaxy in our sample, excluding the outermost (lowest S/N) ring. The result (indicated by the error bars in Figure 5) is only a slight drop in the mean Avel, from 1.1 to 1.0. While this decrease could be due to removing the lowest S/N outer ring where the velocity uncertainty is highest, it could also be due to the outermost ring having the highest rotation curve asymmetry, as found by Cramer et al. (2020) in a molecular gas study of a ram pressure stripped Virgo cluster galaxy. Either way, it is a small enough decrease (∼8%) that it is unlikely the high asymmetry is driven primarily by the S/N of our observations.
3.3.3. Velocity Curve Extent
Finally, we note that about half of the galaxies in the Genzel et al. (2020) sample have rotation curve measurements out to up to 2 times the radius than we do. They also, likely due to this, reach the flat or slightly falling part of the rotation curve in almost all the galaxies in their sample, while in contrast, it is difficult to tell with our data if we have reached this same radius in most of our galaxies. Furthermore, it is not necessarily clear whether any of the galaxies in our sample have a flat outer rotation curve, especially since environmental effects like tidal forces and ram pressure stripping can affect the shape of the rotation curve, especially at the outskirts (Boselli et al. 1994; Lee et al. 2017; Cramer et al. 2019). The functional form of the rotation curve could affect the overall shape of the parabolic function fit for measuring  in our sample compared to Genzel et al. (2020).
By inspecting the rotation curves in Figure 4 of Genzel et al. (2020), it is clear that if they had measured all galaxies to about the same radius as we measure (∼1'') there would not be any significant difference in the measured mean asymmetry of their sample. Outside-in effects like harassment, tidal stripping, and ram pressure stripping could be behind the large difference in mean asymmetry behind our sample and the Übler et al. (2021) sample. If so, when compared to Genzel et al. (2020), we would expect, if we could measure gas kinematics out to a similar radius as they did, to see an even greater increase in the mean asymmetry of our sample. This would be assuming that the gas disks in galaxies we observe are not already truncated by environmental effects as has been observed in a number of low-redshift cluster galaxies (e.g., Chung et al. 2009; Cortese et al. 2011; Zabel et al. 2022).
Finally, the resolution of our data is also lower than that of the Genzel et al. (2020) sample in some cases. However, Feng et al. (2020) found in a large-scale analysis of kinematic asymmetry of galaxies from the MaNGA survey that variations in the spatial resolution had no discernible effect on the measured degree of kinematic asymmetry. While this is based on analysis of galaxies from a redshift range of 0 < z < 0.2, it at least partially supports that the resolution difference between our data and the Genzel et al. (2020) sample may not affect the overall results. Furthermore, the Genzel et al. (2020) sample itself spans a redshift range of 0.65 < z < 2.5 and a resolution range of 025–08. While there is little to no kinematic asymmetry measured in any of the galaxies in the sample, they find no correlation between resolution and asymmetry.
4. Discussion
Overall, we find about half the galaxies in our sample (7/14) have a similar Avel value as galaxies in the simulated Übler et al. (2021) sample. Of the five galaxies in our sample for which we could measure  , one galaxy has a value (
 ) that falls within the range of
  1–5 measured in the Genzel et al. (2020) sample. However, our galaxies are on average more asymmetric than either the Übler et al. (2021) sample of simulated galaxies, or the Genzel et al. (2020) sample of field galaxies. Genzel et al. (2020) found that only 3/41 galaxies in their sample had significant asymmetries in the rotation curve. We find that half of the galaxies in our sample have an Avel higher than any galaxy in the Übler et al. (2021) sample, which has an average
  more than 10 times higher than the Genzel et al. (2020) sample. This suggests that kinematic asymmetry is much more common in cluster galaxies. Furthermore, there are a number of galaxies in our sample with extreme degrees of Avel, more than 10 times higher than any galaxy in the Übler et al. (2021) sample.
Our results could be explained by environmental effects that become more extreme as the density of the environment increases, in particular, tidal interactions and ram pressure stripping. The Genzel et al. (2020) sample of field galaxies has the lowest measured asymmetry. The Übler et al. (2021) sample is much more asymmetric than the Genzel et al. (2020) sample. While comparing simulation and observation directly can be difficult to interpret, Übler et al. (2021) note that several of the simulated galaxies they study are in close proximity to massive galaxies. Thus, it is possible that tidal interactions and/or ram pressure effects from the companion galaxy's circumgalactic medium may contribute to the higher velocity asymmetry. Finally, our sample probes the highest density environment, clusters, where we find galaxies with degrees of asymmetry far beyond any galaxies in the field simulated by Übler et al. (2021) or observed by Genzel et al. (2020).
The gas distribution of some of these galaxies helps to support that environmental dependent effects could be responsible for the extreme degrees of kinematic asymmetry we measure. Some of these galaxies have asymmetric distributions of gas that could be consistent with tidal or ram pressure stripped tails (see Figure 9), not seen in any of the galaxies in the Übler et al. (2021) sample. At the current observation depth and resolution, it is difficult to establish whether the morphology of these galaxies is due to tidal or ram pressure interactions. At low redshift, where higher resolution is available, an asymmetric distribution of molecular gas, where the side opposite the tail often has elevated molecular gas fractions, is often a signature of ram pressure (Lee et al. 2017; Cramer et al. 2020, 2021). A lack of disturbance of the stellar disk can also rule out tidal interaction or mergers, although with the currently available optical data on this sample it is difficult to determine whether this is the case. However, we note that the PVDs of 12/14 of these galaxies show only a single velocity component in PVD space at all offsets, and a strong rotation. This makes them generally inconsistent with being classified as mergers as identified by Jones et al. (2021) in a similar survey of the morphology and ionized gas kinematic profiles of high-redshift galaxies. The other 2/14 galaxies may be mergers, but the PVD is complex to interpret (see Appendix A for individual PVDs of each galaxy). The galaxy J0224-3656 has two strong components at the same offset, separated significantly in velocity space, but has a relatively normal overall rotation curve. J0224-336 has a complex kinematic pattern and an irregular stellar body, and so is likely to be a recent merger or major accretion.
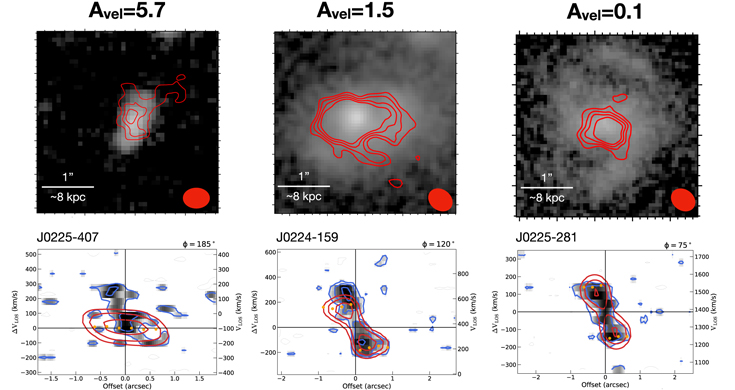
Figure 9. Top: an HST image of the galaxies J0225-407, J0224-424, and J0224-159, each in the F160W filter. Overlaid in red contours is the ALMA CO(2−1) moment 0 (intensity) map, with contour levels of 225. The blue contours show a smoothed version of the data (shown in black) for comparison with the red contours, which show the model. Both contours are shown with levels of 2
Download figure:
Standard image High-resolution imageFurthermore, we note that a reason for the difference in the degree of asymmetry in our sample and that of Übler et al. (2021) could be that we probe down to a lower stellar mass range (M* = 109.5 M⊙) than Übler et al. (2021). It has been well documented that low-mass galaxies in clusters have higher H i deficiencies as a result of ram pressure stripping (Cortese et al. 2011). The results of a Spearman rank correlation test also support a moderate monotonic correlation between decreasing stellar mass and increasing asymmetry. Moreover, the Genzel et al. (2020) sample of field galaxies has no trend with stellar mass and asymmetry, supporting that this relation may be the result of an environmental density-dependent effect. A future rigorous study of the stellar body of galaxies in our sample could help us to identify or rule out tidal interaction, and establish the degree to which the high rate of asymmetry could be due to ram pressure.
We found particularly high gas fractions in galaxies in these z = 1.6 clusters (see Noble et al. 2017, 2019) for more analysis). High gas fractions in the disks and the tails of jellyfish galaxies have been found at low redshift as well (Jáchym et al. 2017; Moretti et al. 2018, 2020). If the cause of the elevated kinematic asymmetry rates in clusters we observe is primarily due to ram pressure, we might expect to see a correlation between the degree of kinematic asymmetry and the gas fraction. However, as seen in Figure 5, and as illustrated by the results of a Spearman rank correlation test showing very weak correlation between gas fraction and kinematic asymmetry, this does not appear to be the case. A larger sample size across a larger range of clusters may help to determine with more certainty whether such a trend exists.
5. Conclusion
In summary, we have conducted the first large-scale characterization of the kinematic asymmetry of the molecular gas of high-redshift (z = 1.6) cluster galaxies. Through an analysis of the kinematic asymmetry, conducted with the use of the kinematic modeling software 3DBarolo (Teodoro & Fraternali 2015), we have modeled the rotation curve and quantified the degree of kinematic asymmetry in each of the 14 galaxies in our sample. When compared to field galaxies at similar redshift from observations (Genzel et al. 2020) and simulation (Übler et al. 2021) we find some galaxies in our sample with similar asymmetry values. We note that only 7/41 galaxies from the Genzel et al. (2020) sample are observed in molecular gas, with the remainder being ionized gas, and Übler et al. (2021) also model this gas phase. However, several published studies find very little measurable difference in rotation curves derived from ionized versus molecular gas (Genzel et al. 2013; Übler et al. 2018; Su et al. 2022). 12/14 of the galaxies in our sample have higher asymmetry than the average galaxy in the Genzel et al. (2020) sample, and 7/14 have higher asymmetry than the average galaxy in the Übler et al. (2021) sample. Furthermore, several galaxies have kinematic asymmetry to a significantly higher degree than any galaxies in either of the reference samples. These galaxies have asymmetry values at least 10 times higher than any galaxy from Übler et al. (2021), and at least 50 times higher than any galaxy in the Genzel et al. (2020) sample. In some cases, they also have visible head-tail gas morphology suggestive of tidal and/or ram pressure interaction (as first noted in Noble et al. 2019), both of which are more common in the inner regions of dense environments like clusters when compared to the field. This is the first evidence of such an effect on molecular gas velocity fields of galaxies in clusters at high redshift.
While these results shed light on the importance of environmental effects on the evolution of molecular gas in galaxies in a novel regime, i.e., the high-redshift universe, we stress that this study only scratches the surface. Large-scale kinematic asymmetry studies of galaxies in low-redshift clusters are still very limited. In the future, a comparison of the rate and degree of kinematic asymmetry, and how it changes with cluster redshift, mass, and evolutionary stage, would be very important to our understanding of the evolution of galaxies in clusters across cosmic time.
We thank Enrico Di Teodoro for help in optimizing the 3DBarolo software package for our data. We also thank Delaney Dunne for insights and discussion on kinematic modeling software. Thank you as well to the anonymous referee, who provided very helpful comments and suggestions.
This work was supported in part from HST program number GO-16300. A.N. additionally acknowledges support from the Beus Center for Cosmic Foundations at Arizona State University, and from the NSF through award SOSPA7-025 from the NRAO. G.W. gratefully acknowledges support from the National Science Foundation through grants AST-1517863 and AST-2205189, and from HST program numbers GO-15294 and GO-16300. Support for program numbers GO-15294 and GO-16300 was provided by NASA through grants from the Space Telescope Science Institute, which is operated by the Association of Universities for Research in Astronomy, Incorporated, under NASA contract NAS5-26555. J.N. is supported by Universidad Andres Bello internal grant DI-07-22/REG. M.C. acknowledges support from NSF grant AST-1815475. R.D. gratefully acknowledges support by the ANID BASAL projects ACE210002 and FB210003.
This paper makes use of the following ALMA data: ADS/JAO.ALMA#2017.1.01228.S, 2018.1.00974.S. ALMA is a partnership of ESO (representing its member states), NSF (USA) and NINS (Japan), together with NRC (Canada), MOST and ASIAA (Taiwan), and KASI (Republic of Korea), in cooperation with the Republic of Chile. The Joint ALMA Observatory is operated by ESO, AUI/NRAO, and NAOJ. The National Radio Astronomy Observatory is a facility of the National Science Foundation operated under cooperative agreement by Associated Universities, Inc. Based on observations made with the NASA/ESA Hubble Space Telescope, and obtained from the Hubble Legacy Archive, which is a collaboration between the Space Telescope Science Institute (STScI/NASA), the Space Telescope European Coordinating Facility (ST-ECF/ESA) and the Canadian Astronomy Data Center (CADC/NRC/CSA).
Software: CASA (v6.1.0; McMullin et al. 2007), Python maskmoment (https://github.com/tonywong94/maskmoment) IDL mommaps (https://github.com/tonywong94/idl_mommaps), 3DBarolo (Teodoro & Fraternali 2015), DYSMAL (Cresci et al. 2009).
Appendix A: Alternative Methods for Quantifying Asymmetry
In addition to the Avelocity parameter, shown in Equation (1), and the  parameter described in Section 3.2.2, we also consider a third method for comparing the asymmetry of each galaxy, by comparing the approaching and receding sides in 2D PVD space. This is similar to the method described in Genzel et al. (2020) and Übler et al. (2021). We calculate the total overlapping number of pixels above 2
 with our sample having the highest average asymmetry, followed by the sample from Übler et al. (2021), and then the sample from Genzel et al. (2020). The results for each galaxy in our sample are also well correlated with the overall degree of asymmetry produced by the Avelocity method (see Figure A1).
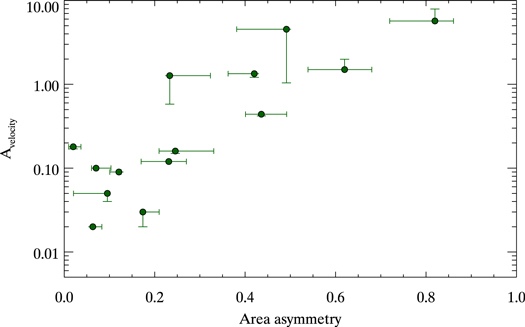
Figure A1. A comparison between asymmetry calculation methods, Avelocity shown in Equation (1), and the overlapping area of the PVD fit to each side, considering all pixels above 2
Download figure:
Standard image High-resolution imageHowever, this method may be more unreliable for identifying kinematic asymmetry that is the result of the environment. It is more influenced by the modeled velocity dispersion at each ring fit than the Avelocity method. While references for this sort of study are still rare, Cramer et al. (2020) found a clear difference in the rotation curve in a ram pressure stripped galaxy, but less clear evidence of a difference in the overall velocity dispersion of the molecular gas between the two sides. Thus, it is likely more reliable to focus on the results from the Avelocity method when searching for evidence of environmental interaction.
Appendix B: Exploring the Effects of Different Weighting Schemes on the Asymmetry Measurement
As an additional test of our asymmetry calculation's robustness, we experimented with different weighting schemes for the reduction of the ALMA data. Uniform weighting resulted in objects with too few fitted rings for analysis, due to the reduced S/N, and so would not be recommended for similar studies. Briggs weighting, using an r = 0.5, resulted in enough pixels for 3DBarolo analysis of half the sample. The results are shown in Figure B1. Both methods result in a similar overall shape to the rotation curve, but there are significantly fewer pixels in the Briggs weighted version, which results in a more poorly constrained overall fit.

Figure B1. A comparison between the PVDs (major and minor axis slices) of J0224-424 produced by different weighting schemes, along with the corresponding fits from 3DBarolo. Overall the fits are similar, but the total number of detected pixels drops significantly, which can lead to increased uncertainty in the fit.
Download figure:
Standard image High-resolution imageThe overall results on the asymmetry of Briggs weighting versus natural weighting are shown in Figure B2. The mean Avelocity for this smaller sample of Briggs weighted galaxies is 0.45, versus 0.58 for natural weighting (also for this smaller sample), a difference of ∼20%. The mean area asymmetry for the Briggs weighted galaxies is 0.35, versus 0.31 for natural weighting, a difference of ∼12%. Overall this is a small enough difference that we believe similar observations in terms of depth and resolution imaged with Briggs weighting could be used for this approach; however, given the big difference in available pixels for the fit seen in Figure B1, we would recommend the natural weighting scheme when using this asymmetry quantization scheme.
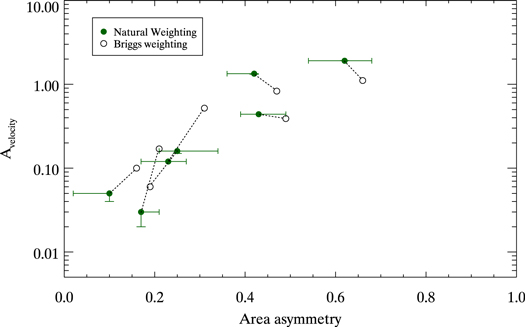
Figure B2. A comparison between asymmetry calculation methods, Avelocity shown in Equation (1), and the overlapping area of the PVD fit to each side, considering all pixels above 2
Download figure:
Standard image High-resolution imageAppendix C: PVD and Asymmetry Measurements
Here we show the moment maps generated by 3DBarolo of each galaxy in our sample, as well as a PVD of the data and the model cube made from fitting the rotation velocity and velocity dispersion of only the approaching side and only the receding side (Figures C1–C14). The galaxies are ordered from highest to lowest Avel (as defined in Equation (1)), the same order as shown in Figure 6.
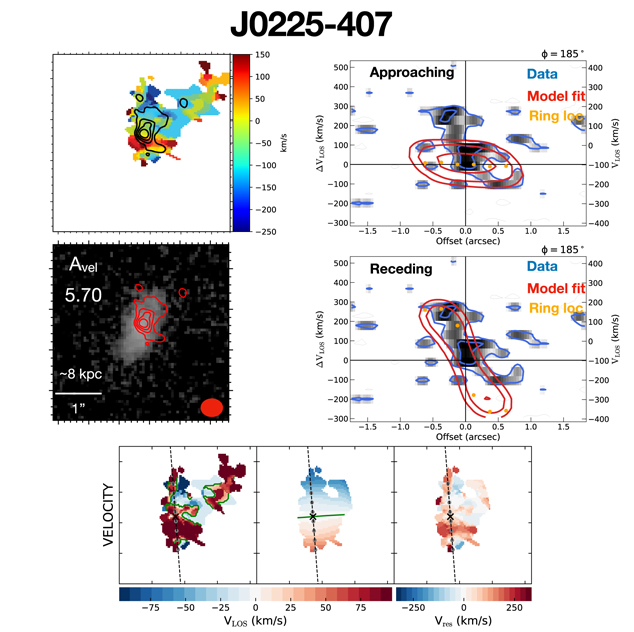
Figure C1. Top left: a moment 1 (velocity) map produced by the Search routine in 3DBarolo, with the moment 0 (intensity) map overlaid in black contours. Contour levels are 225, fit only to the approaching side of the galaxy. The blue contours show a smoothed version of the data (shown in black) for comparison with the red contours, which show the model. Both contours are shown with levels of 2
Download figure:
Standard image High-resolution image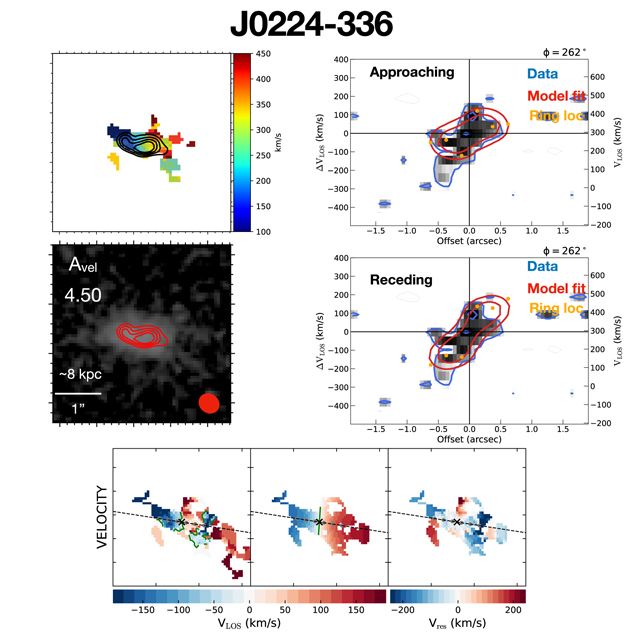
Figure C2. Caption same as that of Figure C1.
Download figure:
Standard image High-resolution image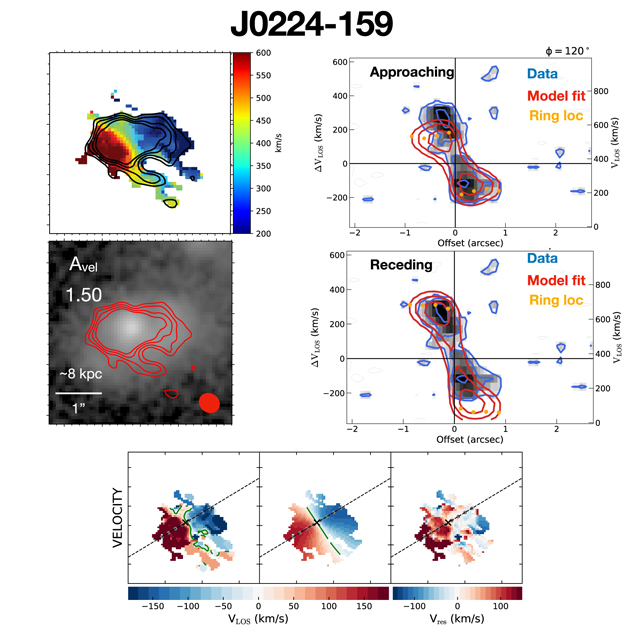
Figure C3. Caption same as that of Figure C1.
Download figure:
Standard image High-resolution image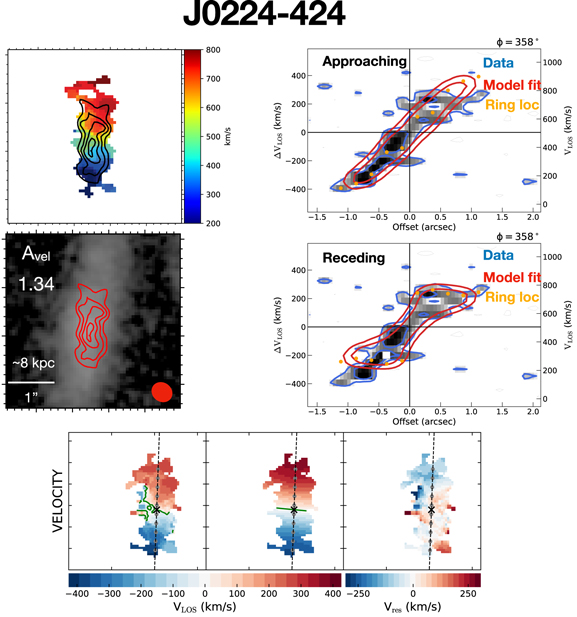
Figure C4. Caption same as that of Figure C1.
Download figure:
Standard image High-resolution image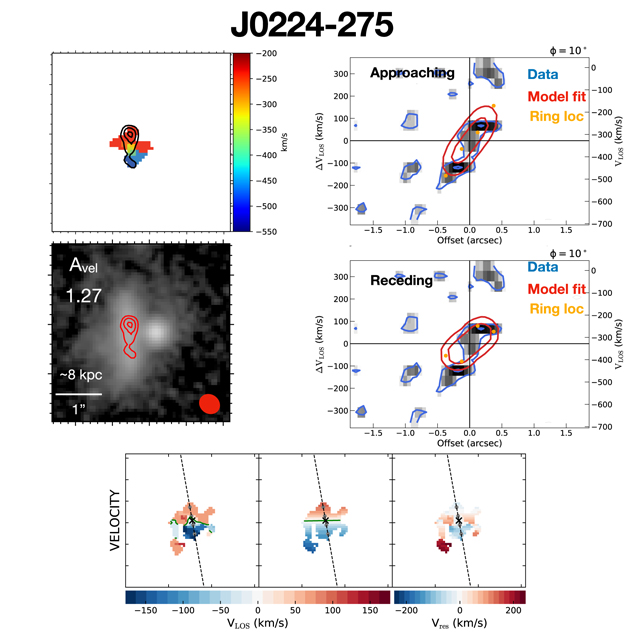
Figure C5. Caption same as that of Figure C1.
Download figure:
Standard image High-resolution image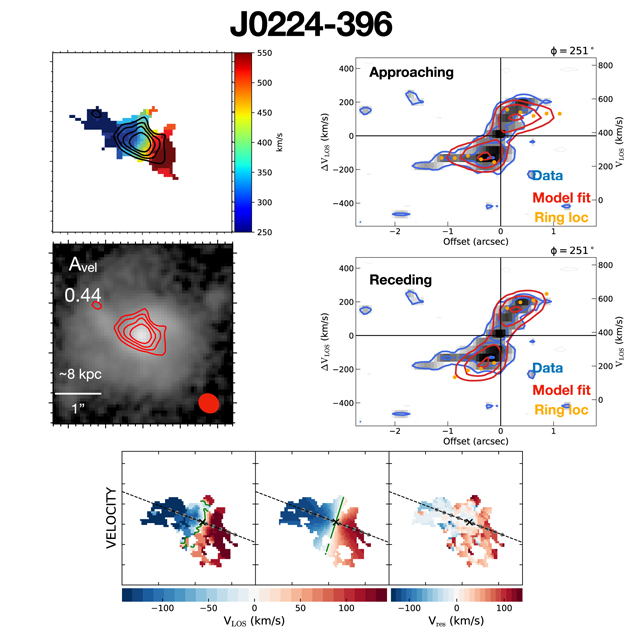
Figure C6. Caption same as that of Figure C1.
Download figure:
Standard image High-resolution image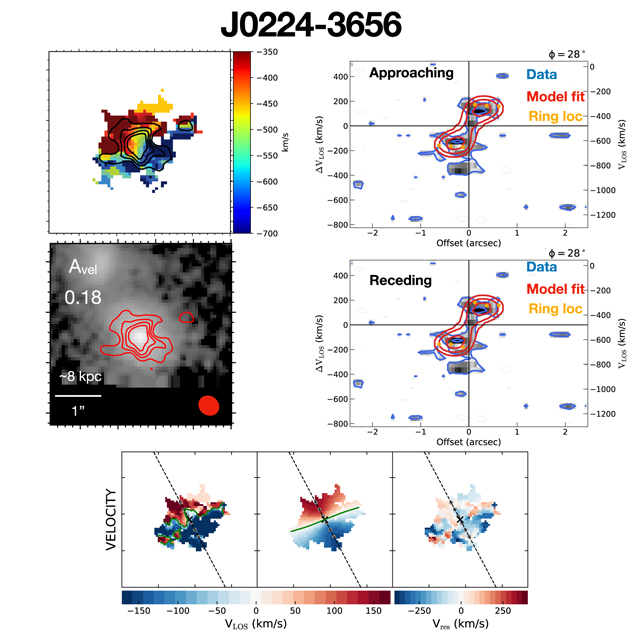
Figure C7. Caption same as that of Figure C1.
Download figure:
Standard image High-resolution image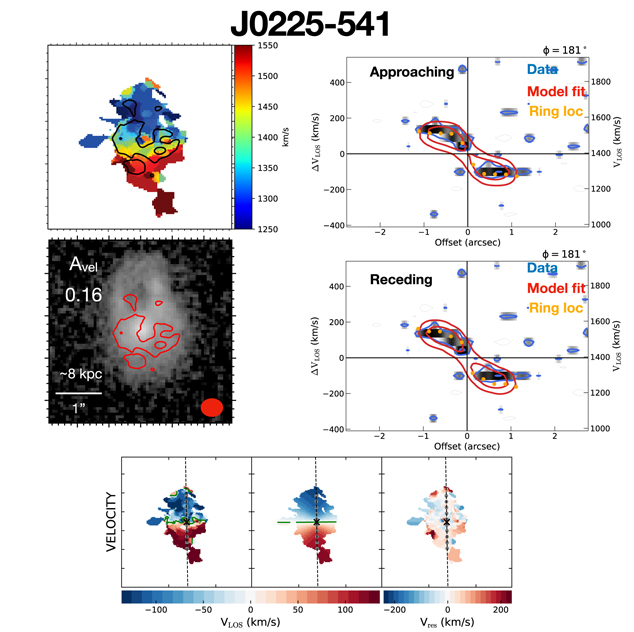
Figure C8. Caption same as that of Figure C1.
Download figure:
Standard image High-resolution image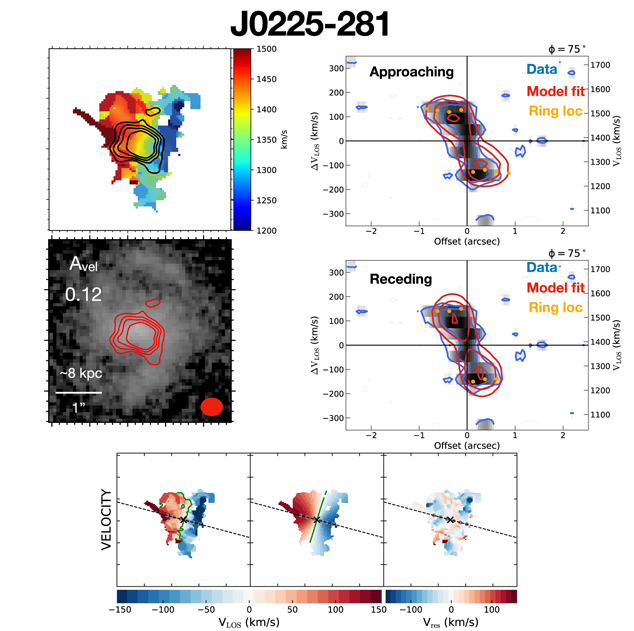
Figure C9. Caption same as that of Figure C1.
Download figure:
Standard image High-resolution image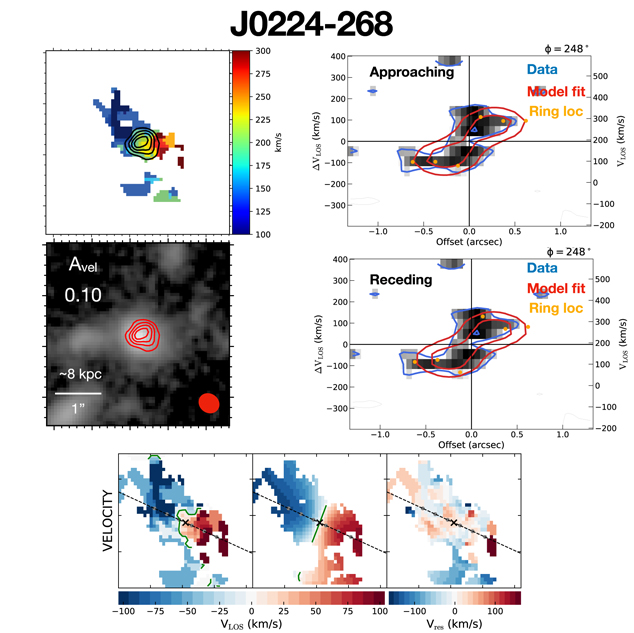
Figure C10. Caption same as that of Figure C1.
Download figure:
Standard image High-resolution image
Figure C11. Caption same as that of Figure C1.
Download figure:
Standard image High-resolution image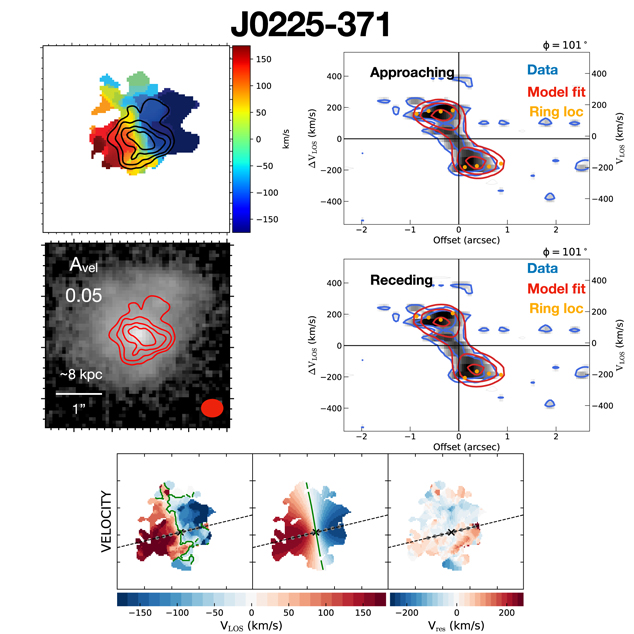
Figure C12. Caption same as that of Figure C1.
Download figure:
Standard image High-resolution image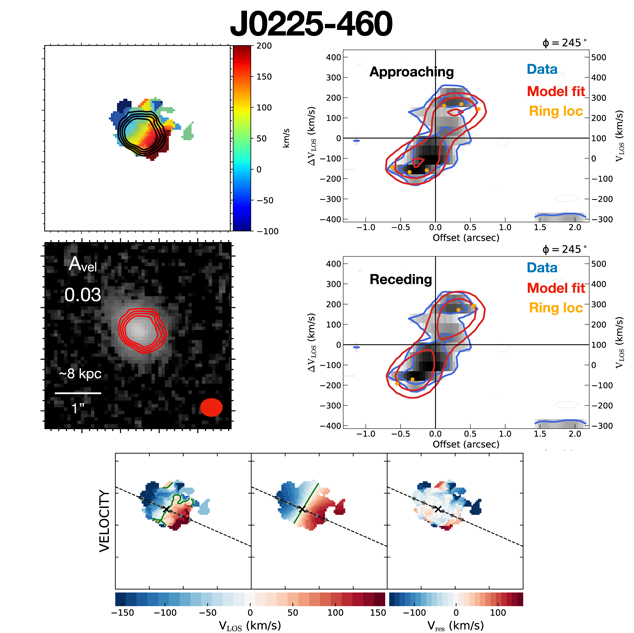
Figure C13. Caption same as that of Figure C1.
Download figure:
Standard image High-resolution image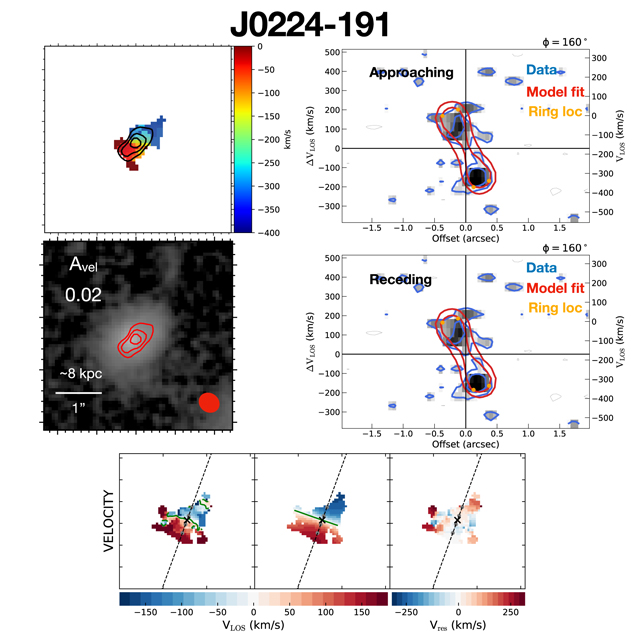
Figure C14. Caption same as that of Figure C1.
Download figure:
Standard image High-resolution image