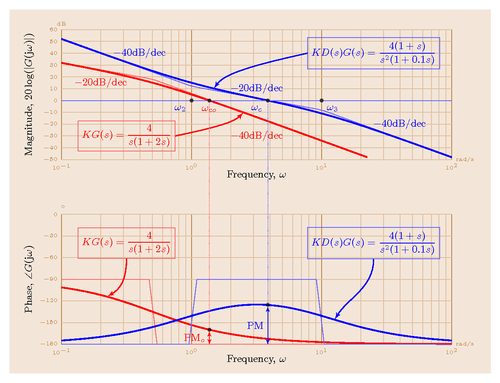
This tikz example display two bode plots. It requires the bodegraph package and GNUPLOT.
Do you have a question regarding this example, TikZ or LaTeX in general? Just ask in the
LaTeX Forum.
Oder frag auf Deutsch auf TeXwelt.de.
En français: TeXnique.fr.
%& -shell-escape
% Create a Bode plot using Papanicola Robert's package bodegraph:
% http://www.sciences-indus-cpge.apinc.org/Bode-Black-et-Nyquist-avec-Tikz
% Author: Dazhi Jiang
\documentclass[10pt]{article}
\usepackage{amsmath,amssymb}
\usepackage{tikz}
\usepackage{bodegraph}
\usetikzlibrary{intersections}
\usetikzlibrary{calc}
\usetikzlibrary{positioning}
\begin{document}
% Define the layers to draw the diagram
\pgfdeclarelayer{background}
\pgfdeclarelayer{foreground}
\pgfsetlayers{background,main,foreground}
\begin{tikzpicture}[>=latex',
ref lines/.style={thin, blue!60},
ref points/.style={circle, black, opacity=0.7, fill, minimum size= 3pt, inner sep=0},
every node/.style={font=\small},
bode lines/.style={very thick, blue},
Gclabel/.style={text=blue},
xscale=12/3]
\begin{scope}[yscale=4/110]
\UnitedB
\semilog{-1}{2}{-50}{60}
% Bode plot (magnitude) for the original system, 4/(s/(1+2s)).
% Asymptotic line
\BodeAmp[ref lines, red!60]{-1:1.35}{\POAmpAsymp{4}{2.0}+\IntAmp{1}}
% Bode plot
\BodeAmp[bode lines, red, name path=Gomagnitude]{-1:1.35}{\POAmp{4}{2.0}+\IntAmp{1}}
% Bode plot (magnitude) for the compensated system, 4(1+s)/(s^2/(1+0.1s)).
% Asymptotic line
\BodeAmp[ref lines]{-1:2}{\APAmpAsymp{4}{0.1}{10}+2*\IntAmp{1}}
% Bode plot
\BodeAmp[bode lines, name path=magnitude]
{-1:2}{\APAmp{4}{0.1}{10}+2*\IntAmp{1}}
% Reference line, (0dB )
\draw [name path=unitygain, ref lines] (-1,0) -- (2,0);
% Crossover frequency of the original system
\path [name intersections={of=magnitude and unitygain, by=crossover}];
\node (coref) [ref points, label={[blue]below left:$\omega_c$}]
at (crossover) {};
% Crossover frequency of the compensated system
\path [name intersections={of=Gomagnitude and unitygain, by=Gocrossover}];
\node (Gocoref) [ref points, label={[red]below:$\omega_{co}$}]
at (Gocrossover) {};
% Labels for the original system (open-loop)
\node [Gclabel, text=red] at (-0.7, 15) {$-20$dB/dec};
\node [Gclabel, text=red] at (0.5, -30) {$-40$dB/dec};
\node (KG) [Gclabel, red!60, text=red, draw]
at (-0.5, -30) {$KG(s)=\dfrac{4}{s(1+2s)}$};
\draw (KG.east) edge [->, shorten >=1pt, thick, red, bend right=1.5]
(0.4, -10);
% Labels for the compensated system (open-loop)
\node [ref points, label={[blue]below left:$\omega_2$}] at (0, 0) {};
\node [ref points, label={[blue]below right:$\omega_3$}] at (1, 0) {};
\node [Gclabel] at (-0.4, 40) {$-40$dB/dec};
\node [Gclabel] at (0.5, 10) {$-20$dB/dec};
\node [Gclabel] at (1.6, -20) {$-40$dB/dec};
\node (KDG) [Gclabel, blue!60, text=blue, draw]
at (1.4, 40) {$KD(s)G(s)=\dfrac{4(1+s)}{s^2(1+0.1s)}$};
\draw (KDG.west) edge [->, shorten >=1pt, thick, blue, bend right=1.5]
(0.17, 10);
% Axes label
\node [below=6pt] at (0.5,-50) {Frequency, $\omega$};
\node [rotate=90] at (-1.25,5) {Magnitude, $20\log(|G(\text{j}\omega)|)$};
\end{scope}
\begin{scope}[yshift=-3.5cm,yscale=4/180]
\UniteDegre
\OrdBode{30}
\semilog{-1}{2}{-180}{0}
% Bode plot (phase) for the original system, 4/(s/(1+2s)).
% Asymptotic line
\BodeArg[ref lines, red!60]{-1:2}{\POArgAsymp{4}{2.0}+\IntArg{1}}
% Bode plot
\BodeArg[bode lines, red, name path=Gophase]{-1:2}{\POArg{4}{2}+\IntArg{1}}
% Bode plot (magnitude) for the compensated system, 4(1+s)/(s^2/(1+0.1s)).
% Asymptotic line
\BodeArg[ref lines]{-1:2}{\APArgAsymp{4}{0.1}{10}+2*\IntArg{1}}
% Bode plot
\BodeArg[bode lines, name path=phase]{-1:2}{\APArg{4}{0.1}{10}+2*\IntArg{1}}
% Phase margin of the original system
\path [name path=Gowcref] (Gocrossover) -- ++(0,-330);
\path [name intersections={of=Gophase and Gowcref, by=Gophasemargin}];
\node (Gopmref) [ref points] at (Gophasemargin) {};
\draw [ref lines, red!60, densely dotted] (Gocoref.south) -- (Gopmref.north);
\draw [ref lines, <->, red] let \p1=(Gophasemargin)
in
(Gopmref.south) -- node[left, Gclabel, text=red] {$\text{PM}_o$} (\x1,-180);
% Phase margin of the compensated system
\path[name path=wcref] (crossover) -- ++(0,-300);
\path [name intersections={of=phase and wcref, by=phasemargin}];
\node (pmref) [ref points] at (phasemargin) {};
\draw [ref lines, densely dotted] (coref.south) -- (pmref.north);
\draw [ref lines, <->, blue] let \p1=(phasemargin)
in
(pmref.south) -- node[left, Gclabel] {PM} (\x1,-180);
% System Labels
\node (KGphase) [Gclabel, red!60, text=red, draw]
at (-0.5, -40) {$KG(s)=\dfrac{4}{s(1+2s)}$};
\draw[->, shorten >=1pt, thick, red]
(KGphase.south) .. controls +(down:30) and +(0.1,10) .. (-0.65, -114);
\node (KDGphase) [Gclabel, blue!60, text=blue, draw]
at (1.4, -40) {$KD(s)G(s)=\dfrac{4(1+s)}{s^2(1+0.1s)}$};
\draw[->, shorten >=1pt, thick, blue]
(KDGphase.south) .. controls +(down:40) and +(0.1,30) .. (1.1, -146);
% Axes label
\node [below=6pt] at (0.5, -180) {Frequency, $\omega$};
\node [rotate=90] at (-1.25, -90) {Phase, $\angle G(\text{j}\omega)$};
\end{scope}
% Background
\begin{pgfonlayer}{background}
\path (-1.4cm,2.8cm) node (tl) {};
\path (2.3cm, -8.4cm) node (br) {};
\path[fill=brown!20] (tl) rectangle (br);
\end{pgfonlayer}
\end{tikzpicture}
\end{document}
Comments
Getting the following error with bodegraph but can't determine how to fix it:
bodegraph.tex(114): Error: ! Package PGF Math Error: Unknown function
int'. bodegraph.tex(114): Error: ! Package PGF Math Error: Unknown function
log10Having a similar problem as the fellow above, can only post portions of the log file. Comment section is limited to 3000 characters.
This is pdfTeX, Version 3.1415926-1.40.10 (TeX Live 2009/Debian) (format=pdflatex 2010.8.30) 5 OCT 2010 08:56 entering extended mode restricted \write18 enabled. %&-line parsing enabled. **bode-plot.tex (./bode-plot.tex LaTeX2e <2009/09/24> Babel and hyphenation patterns for english, usenglishmax, dumylang, noh yphenation, loaded. (/usr/share/texmf-texlive/tex/latex/base/article.cls Document Class: article 2007/10/19 v1.4h Standard LaTeX document class (/usr/share/texmf-texlive/tex/latex/base/size10.clo File: size10.clo 2007/10/19 v1.4h Standard LaTeX file (size option) ) ........
! Package PGF Math Error: Unknown function `int'.
See the PGF Math package documentation for explanation. Type H for immediate help. ...
l.54 \semilog{-1}{2}{-50}{60}
This error message was generated by an \errmessage command, so I can't give any explicit help. Pretend that you're Hercule Poirot: Examine all clues, and deduce the truth by order and method.
! Package PGF Math Error: Unknown function `log10'.
See the PGF Math package documentation for explanation. Type H for immediate help. ...
l.54 \semilog{-1}{2}{-50}{60}
(That was another \errmessage.)
! Package PGF Math Error: Unknown function `log10'. ......
! Package PGF Math Error: Unknown function `int'.
See the PGF Math package documentation for explanation. Type H for immediate help. ...
l.54 \semilog{-1}{2}{-50}{60}
(That was another \errmessage.)
Runaway definition?
1.#2#3\pgfmath@in@@ ->\ifx \pgfmath@in@ #2\pgfmath@in@false \else
! TeX capacity exceeded, sorry [main memory size=3000000]. \pgfmath@in@ ...h@in@false \else \pgfmath@in@true \fi }\pgfmath@in@@ #2#1\pg... l.54 \semilog{-1}{2}{-50}{60}
If you really absolutely need more capacity, you can ask a wizard to enlarge me.
Here is how much of TeX's memory you used: 10350 strings out of 495061 191951 string characters out of 1182621 3000001 words of memory out of 3000000 13309 multiletter control sequences out of 15000+50000 4584 words of font info for 18 fonts, out of 3000000 for 9000 28 hyphenation exceptions out of 8191 47i,7n,58p,1166b,2460s stack positions out of 5000i,500n,10000p,200000b,50000s ! ==> Fatal error occurred, no output PDF file produced!
Adding comments is currently not enabled.