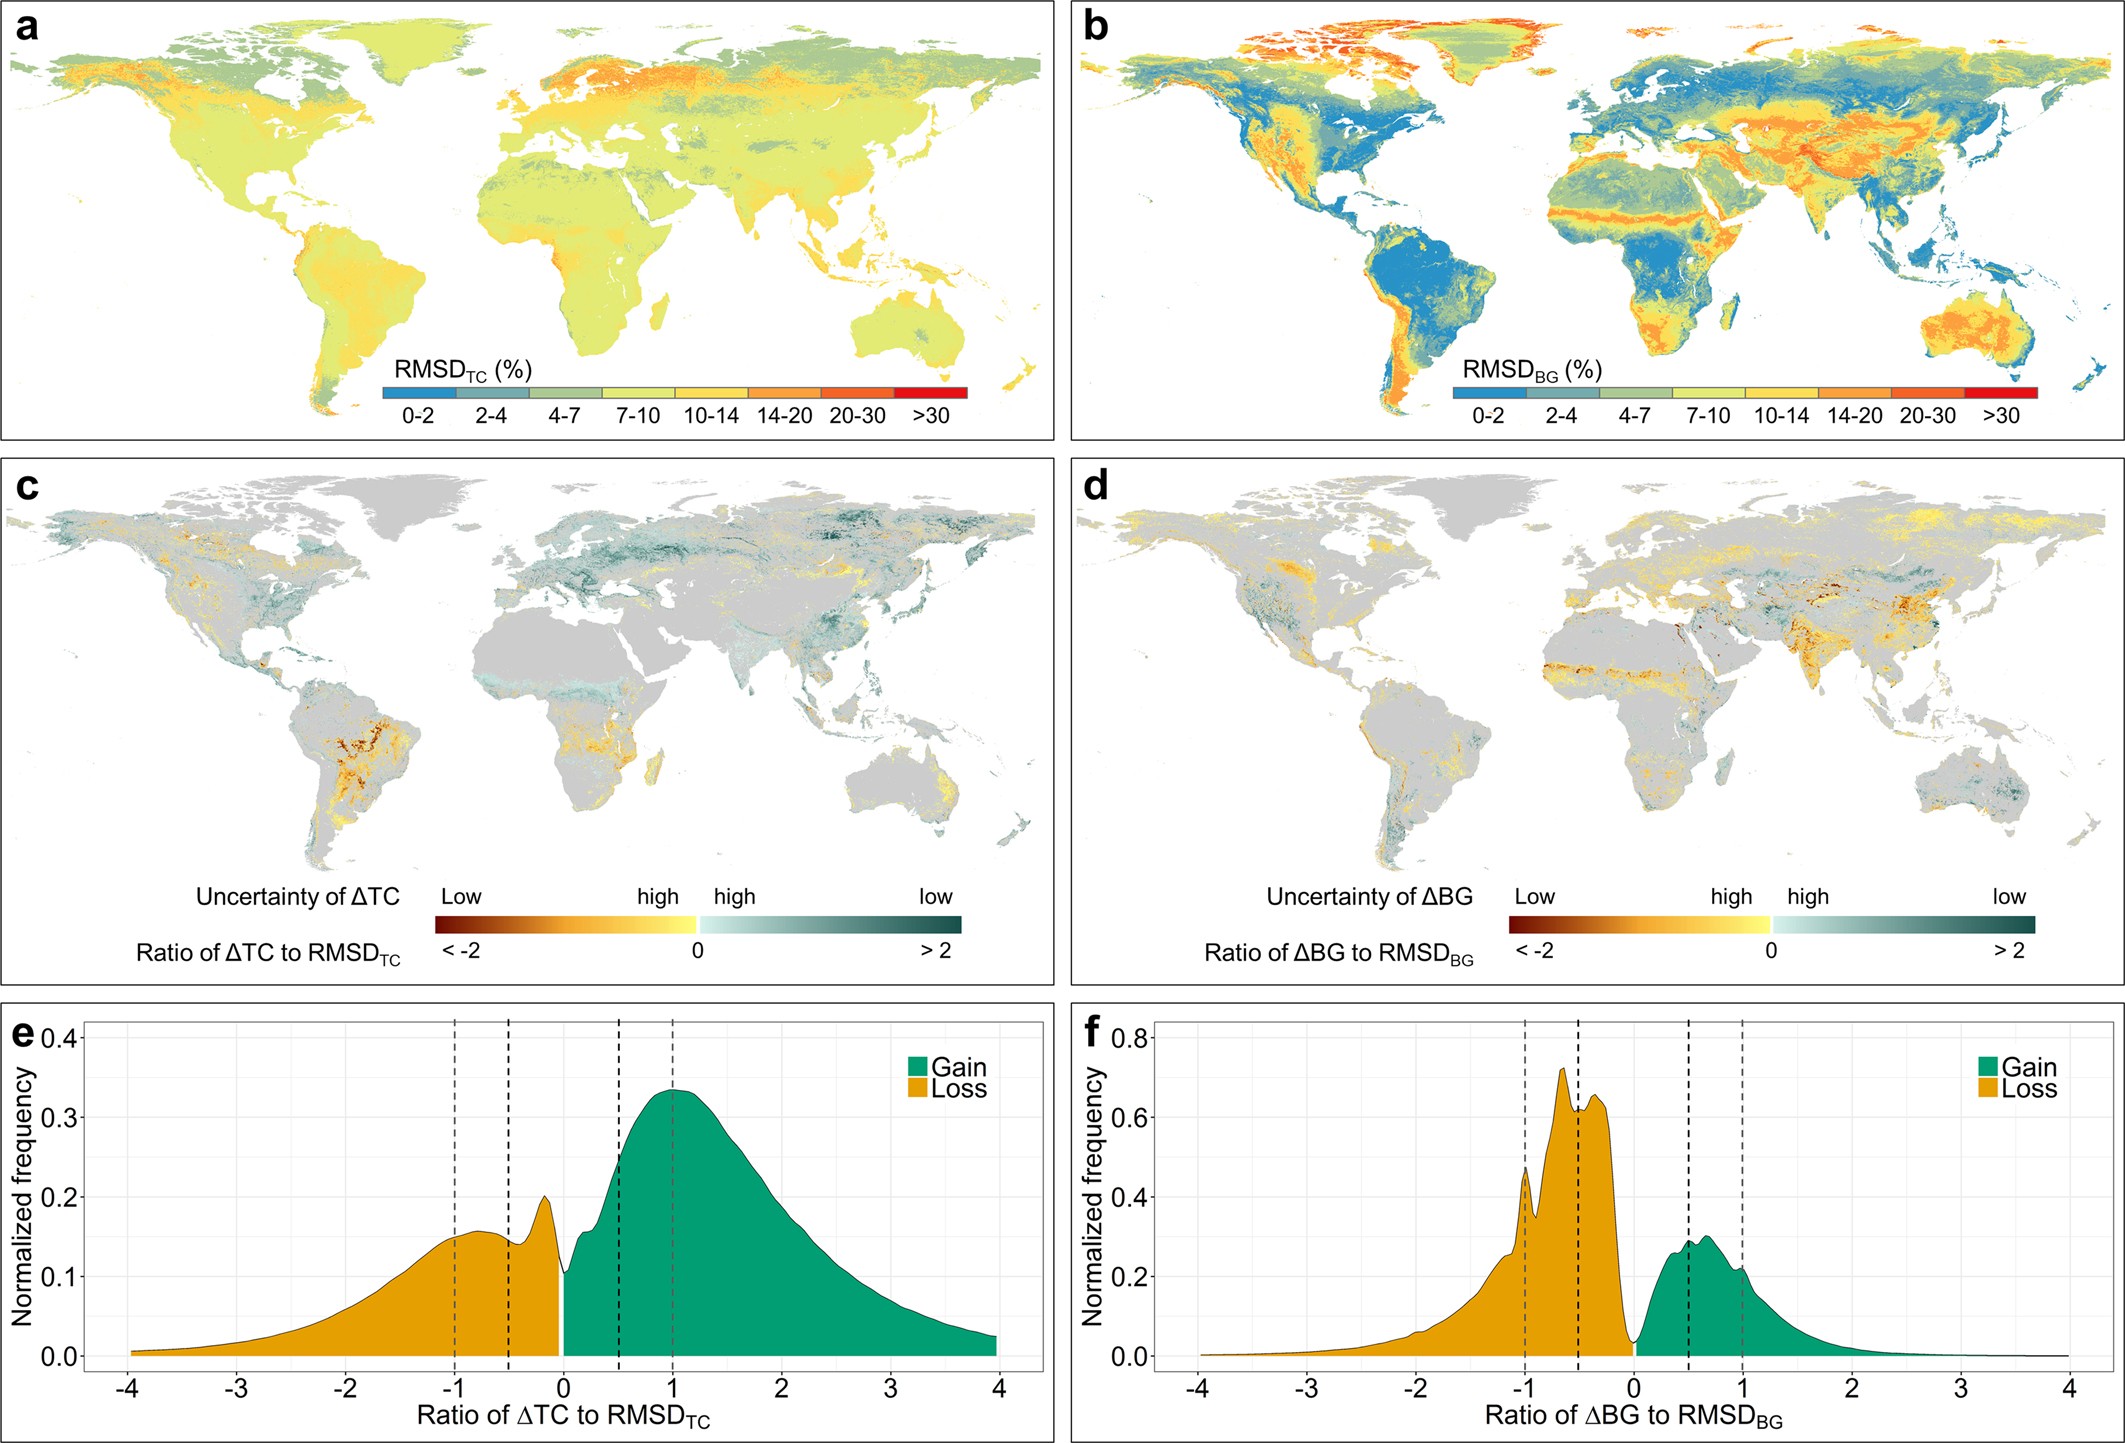
Extended Data Fig. 6: Uncertainty of ∆TC and ∆BG.

a, Spatial distribution of annual mean root-mean-square-deviation (RMSD) of TC between 1982 and 2016. b, Spatial distribution of annual mean RMSD of BG between 1982 and 2016. c, Spatial distribution of ∆TC uncertainty. d, Spatial distribution of ∆BG uncertainty. e, Normalized frequency distribution of ∆TC uncertainty. f, Normalized frequency distribution of ∆BG uncertainty. TC, BG and associated RMSD values are outputs of regression tree models. Uncertainty is represented by the ratio of long-term TC (or BG) change estimates to respective RMSD estimates. Positive values of the ratio metric represent the uncertainties of gains and negative values represent the uncertainties of losses. A greater absolute value indicates lower uncertainty, and vice versa. Area under the frequency distribution equals 1. The frequency distributions suggest that tree cover gain exceeds tree cover loss and bare ground loss exceeds bare ground gain for any threshold level (for example, dashed lines), hence the observed trends (a net gain in tree cover and a net loss in bare ground cover over the study period) are valid.
