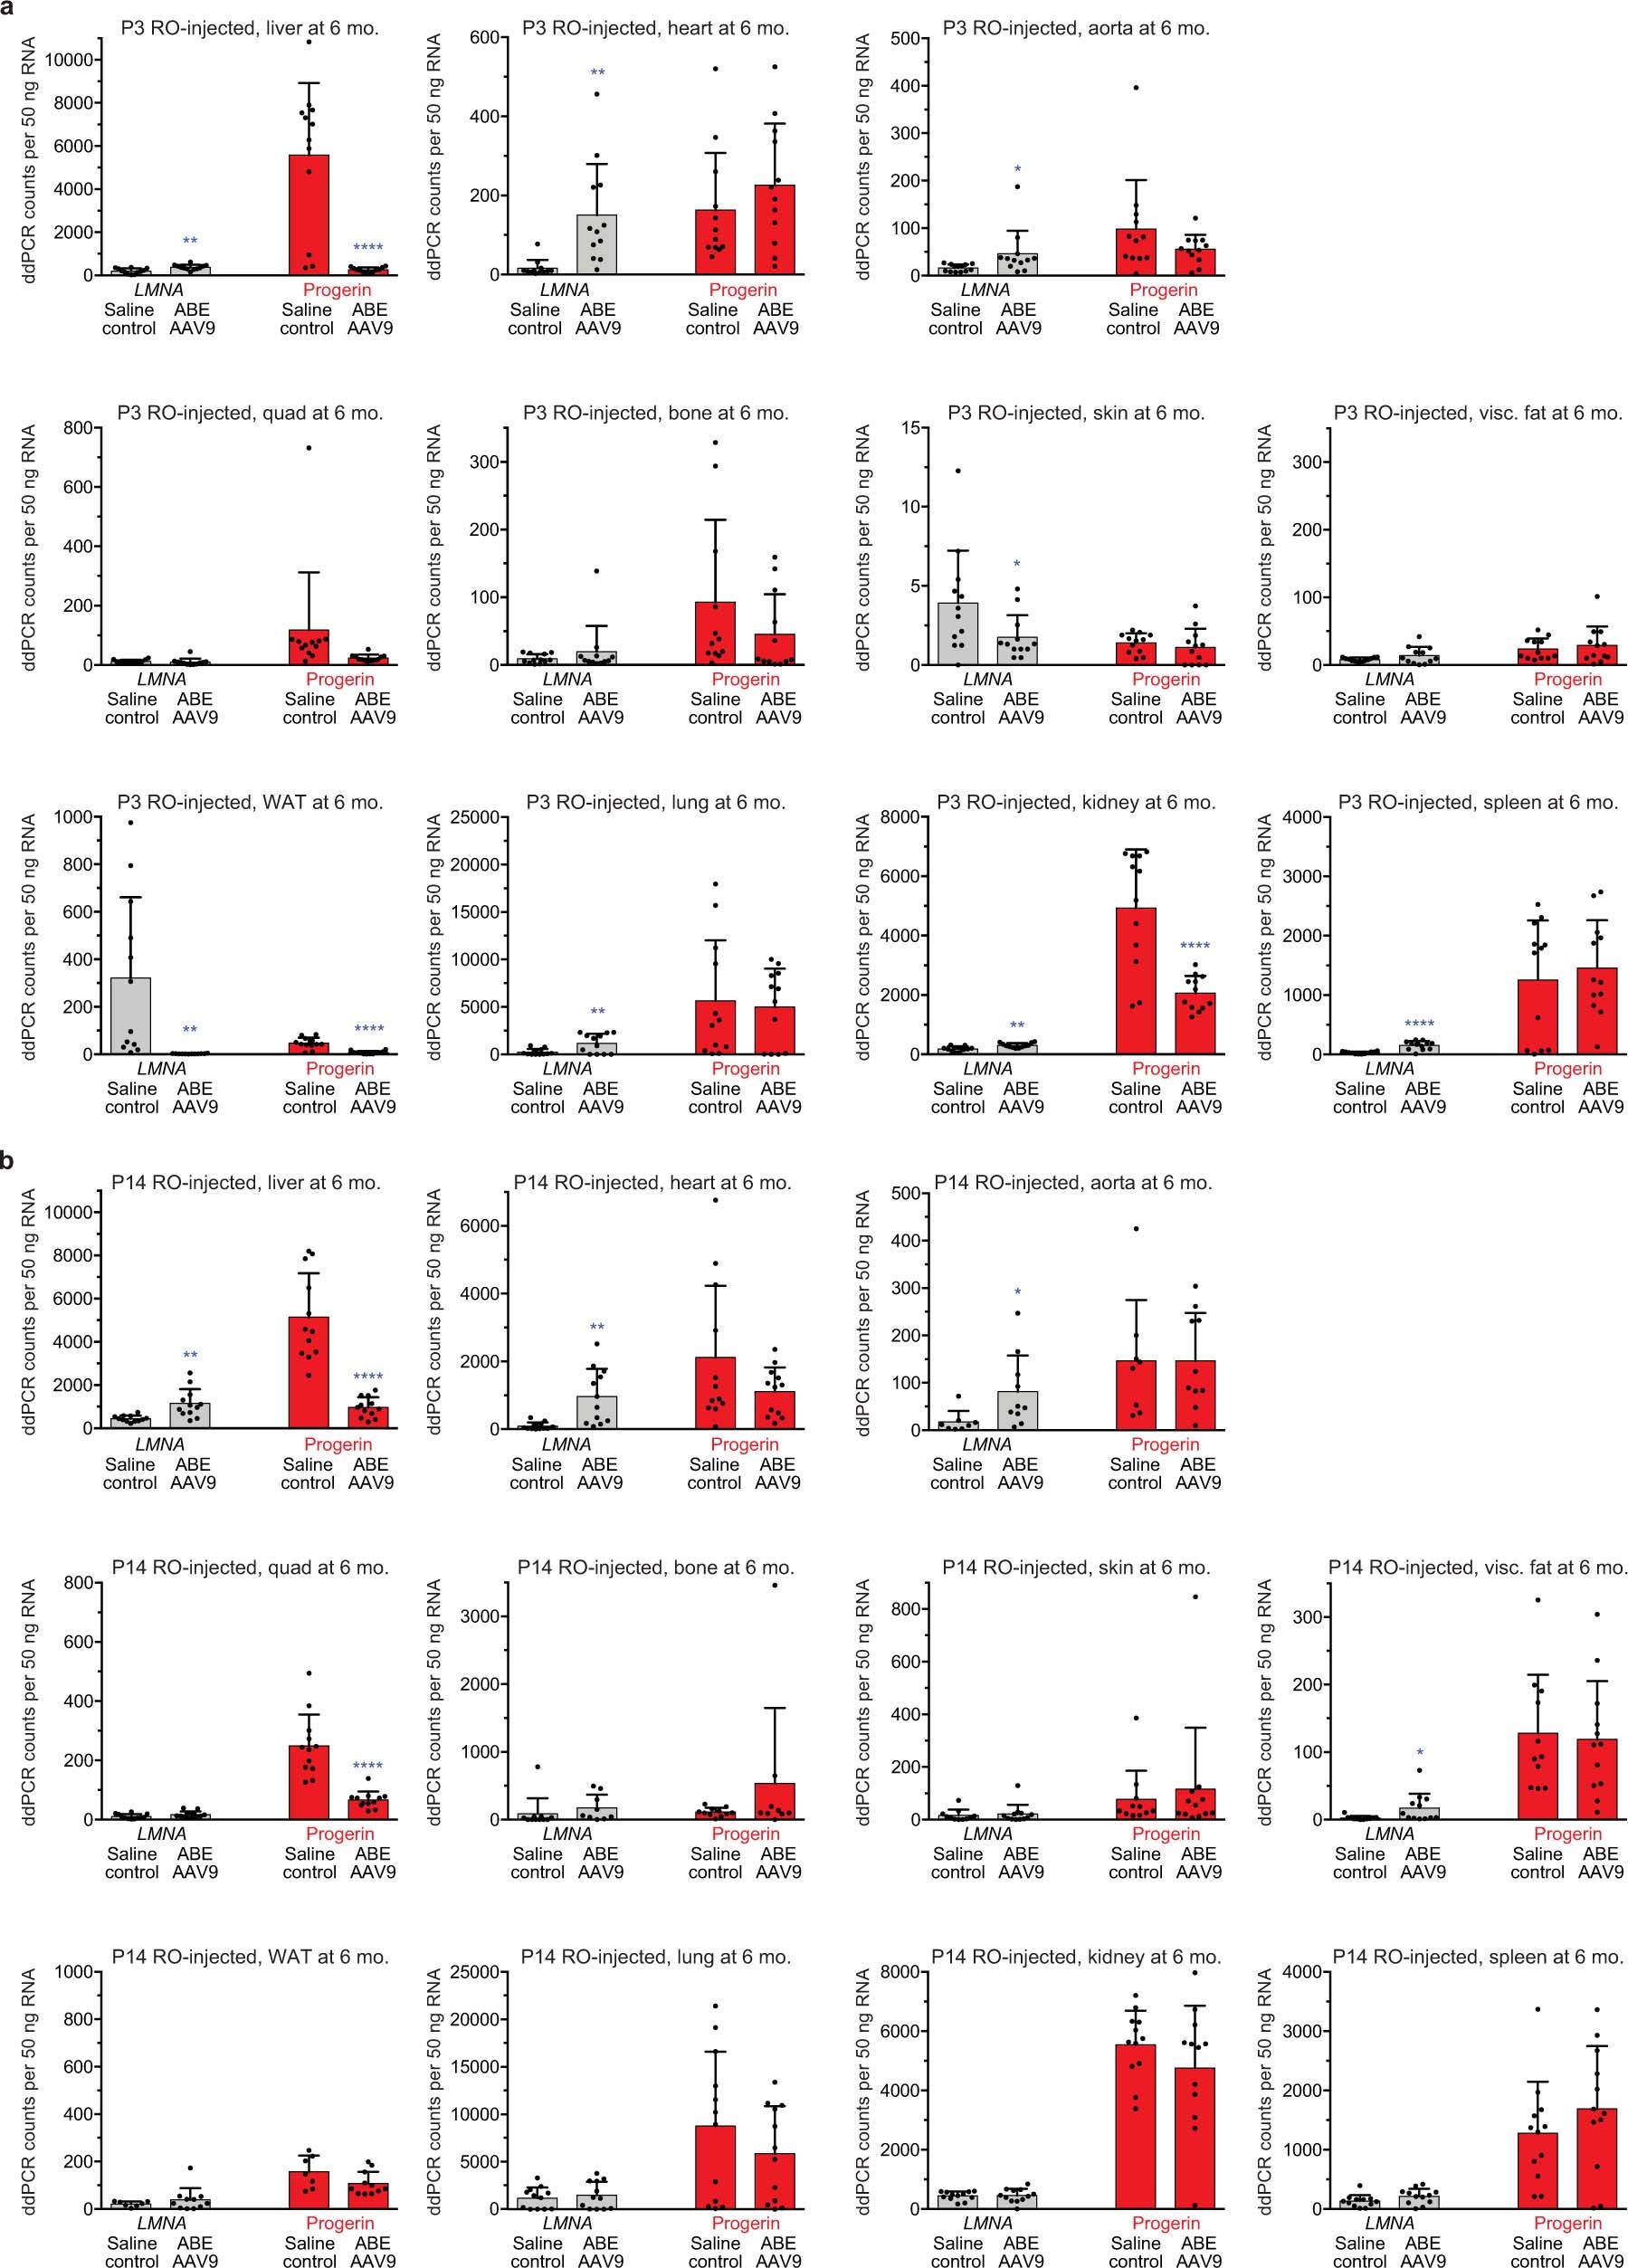
Extended Data Fig. 4: Quantification of LMNA and progerin transcript abundance by ddPCR in mice that were retro-orbitally injected with saline or ABE-AAV9 at P3 or P14.
From: In vivo base editing rescues Hutchinson–Gilford progeria syndrome in mice

a, ddPCR counts for LMNA (grey bars) and progerin (red bars) RNA transcript abundance in P3 RO saline- and ABE-AAV9-injected mice. Data are mean ± s.d. for n = 12 mice. b, ddPCR counts for LMNA (grey bars) and progerin (red bars) RNA transcript abundance in P14 RO saline- and ABE-AAV9-injected mice. Data are mean ± s.d. for n = 12 biological replicates for all samples except for saline-injected mouse skin (n = 11), WAT (n = 7), visceral fat (n = 11), tibia (n = 11) and aorta (n = 8); and ABE-AAV9-injected mouse WAT (n = 11), tibia (n = 9) and aorta (n = 10). Visc. fat, visceral fat. *P < 0.05, **P < 0.01, ***P < 0.001, ****P < 0.0001 by Student’s unpaired two-sided t-test for a, b. Liver and heart values are reproduced from Fig. 3c for ease of comparison.
