
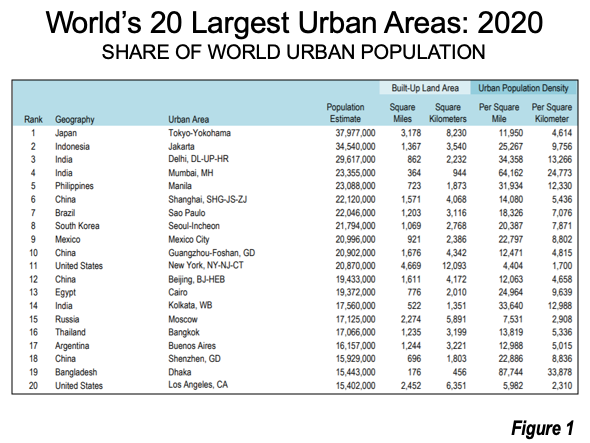
For the first time in more than six decades the world’s second ranked built-up urban area has reached within 10% of leader Tokyo. The 2020 edition of Demographia World Urban Areas reports that Jakarta has reached a population of 34.5 million, behind Tokyo-Yokohama’s 38.0 million (Figure 1). The report can be downloaded here (Note 1). Yet Tokyo’s growth has slowed, a reflection of Japan’s overall demographic implosion, although it is still adding people while the country is losing population.
Background
Built-up urban areas are continuously built-up development that excludes rural lands (Note 2) are formally defined by a number of nations, using relatively similar criteria. Demographia develops urban area definitions (urban perimeters) based on satellite images for all known built-up urban areas for which there is no formal national census authority definition. Demographia combines extensions of continuously built up areas (as designated by census authorities), where they are a part of a larger labor market (such as New York, Bridgeport-Stamford and New Haven, Los Angeles, Riverside-San Bernardino and Mission Viejo and Toronto, Hamilton and Oshawa).
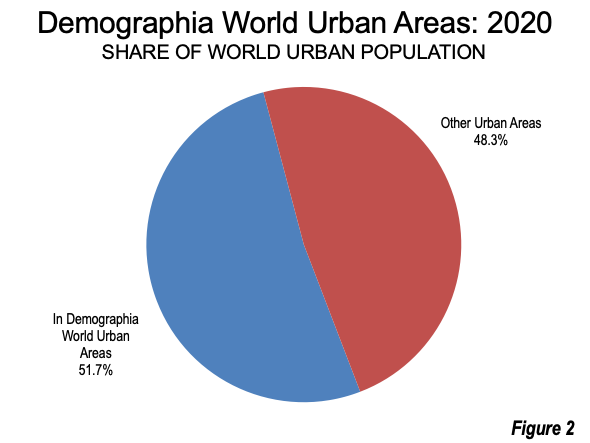
Demographia World Urban Areas provides pre-COVID-19 population estimates for all of the 1,055 identified built-up urban areas with 500,000 or greater population. The list includes a total population equal to 51.7% of the estimated world urban population (Figure 2).
Population estimates are based on national statistical authority estimates for built-up urban areas consistent with international practice are available. Beginning with this year, most other larger built-up urban area populations are estimated based on small area grids that provide population estimates that are tailored for the urban perimeters (Note 3).
Demographia World Urban Areas contains five tables that provide summary and ranking information:
Table 1: World Summary: Built-Up Urban Areas Over 500,000
Table 2: Largest Built-Up Urban Areas in the World
Table 3: Built-Up Urban Areas Ranked by Land Area (Urban Footprint)
Table 4: Built-Up Urban Areas Ranked by Urban Population Density
Table 5: Alphabetical List of Built-Up Urban Areas
The Principal Challenger: Jakarta
Jakarta’s urban area now spreads from the Special Capital Region, to Tangerang and South Tangerang to the West, the city of Bogor to the south and to Karawang Regency to the East. Even with this massive land area of 3,540 square kilometers (1,367 square miles), Jakarta covers less than one-half the territory of Tokyo-Yokohama. But Jakarta’s population density is 9,800 per square kilometer (25,300 per square mile), more than double that of Tokyo-Yokohama’s 4,600 per square kilometer (12,000 per square mile).
However, storm clouds threaten Jakarta’s future growth. The present city site has extreme environmental challenges, such as sinking due to ground water extraction, as well as some of the world’s worst traffic congestion. The government has announced plans to move the capital by 2024 (video) to the sparsely populated province of East Kalimantan on the island of Borneo (about 1,300 kilometers or 800 miles from Jakarta).
A 2024 move date is very aggressive and even if achieved may not slow Jakarta’s pursuit of the number one spot (assuming continuation of present projected growth rates). Previous national capital moves do not appear to have materially reduced the growth in the urban areas the capitals have deserted. For example, Brasilia is perhaps the most successful post-World War II new national capital, measured in terms of its population growth. In the two decades following its 1960 opening, Brasilia struggled to reach 1.3 million residents, while Rio de Janeiro added 4.3 million.
India’s Largest Megacities
However, if in the unlikely event that Jakarta should falter, fast growing Delhi, the world's third largest built-up urban area should pass Tokyo-Yokohama by 2035. Delhi has a population of 29.6 million residents and a density of 13,300 per square kilometer (34,400 per square mile). Delhi should continue to widen the gap over Mumbai that currently stands at 6.5 million. Mumbai used to be India’s largest built-up urban area.
Even so, Mumbai ranks as the fourth largest built-up urban area in the world, with a population density of 24,800 per square kilometer (64,200 per square mile), making it the second densest megacity (built-up urban area over 10 million) in the world, trailing only Dhaka. It is also slightly less dense than Hong Kong, which is the densest high-income world built-up urban area (25,300 per square kilometer 65,600 per square mile).
Other Population Leaders
Manila is now the fifth largest built-up urban area, with 23.1 million residents. Manila has a population density of 12,300 per square kilometer (31,900 per square mile). The top ten built-up urban areas are rounded out by Shanghai, Sao Paulo, Seoul-Incheon, Mexico City and Guangzhou-Foshan.
Largest Urban Footprint (Urban Land Area)
New York has the largest urban footprint of any built-up urban area, covering 12,100 square kilometers (4,700 square kilometers). New York covers about 50 percent more land area than much larger Tokyo-Yokohama and 90 percent more land area than Los Angeles.
Highest Urban Density
Dhaka, ranked 19th with a population of 15.4 million, continues to have the highest urban population density, at 33,900 per square kilometer (87,700 per square mile). This is 19 times as dense as the New York built-up urban area. Kinshasa is the second densest, at 28,500 per square kilometer (73,900 per square mile).
Decline of the West
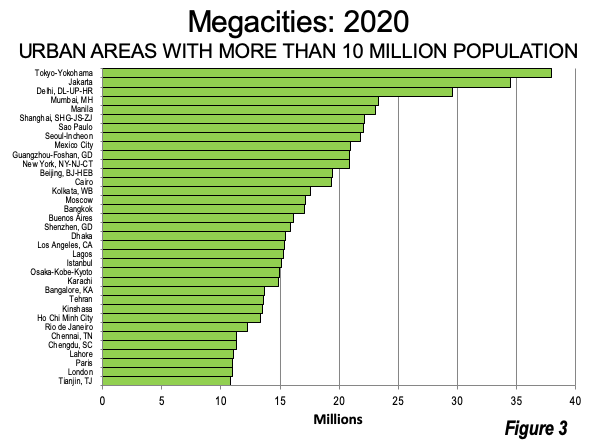
For the first time, the high-income West is not represented in the 10 largest urban areas (Figure 3). In 1950, four such cities — New York, London, Paris and Chicago — were on the United Nations list. New York, which had been the largest built-up urban area from the 1920s to 1950, fell to 11th place, while the others had long ago fallen out. Chicago has suffered the largest drop, from 8th to 41st. That is despite a near doubling of its population from 1950 to 2020. The Los Angeles built-up urban area, which ranked 12th in 1950, nearly quadrupled its population, but fell to 20th, after having reached 6th largest from 1965 to 1975.
Note 1: Demographia World Urban Areas was the first to identify the under-estimation of population in some of the largest urban areas, by other sources. For example, Demographia’s early population estimates for the Jakarta, Delhi, Manila, Seoul-Incheon and Kuala Lumpur built-up urban areas were far higher than reported by others at the time. Other sources have revised their estimates upward. The earlier, lower estimates of others were, in actuality, municipal estimates that did not sufficiently take into consideration the spread of urbanization beyond city or other geographical limits. Demographia’s larger population estimates were the result of examining actual satellite maps to determine the extent of individual built-up urban areas.
Note 2: Demographia World Urban Areas is in its 16th year of publication. It was established for the purpose of bringing some consistency to the subject of urban density, in hopes of replacing often grossly invalid anecdotal comparisons between cities. The built-up urban area is the only level at which there is sufficiency consistency and sufficient data to estimate the densities of the urban organism at anything approximating international standards.
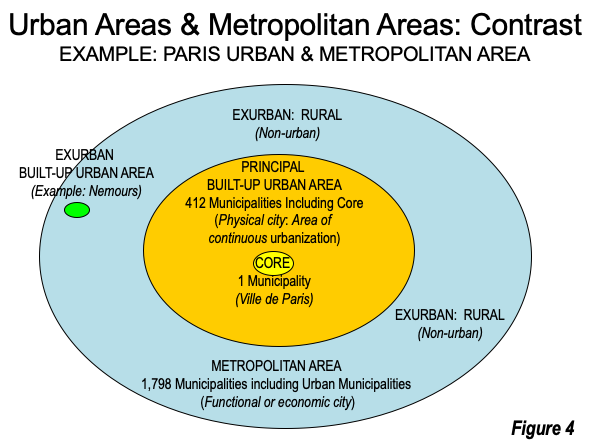
There continues to be considerable confusion about the measurement of urban densities. The key is in comprehending the differences between urban areas and metropolitan areas. Built-up urban areas are continuously built-up development that excludes rural lands. This is illustrated by the Paris built up urban area and the Paris metropolitan area in Figure 4. Built-up urban areas are the city in its physical form, as opposed to metropolitan areas, which are the economic or functional cities (the labor and housing markets). These terms are defined by Cheshire, et al. of the London School of Economics (see: “People rather than places, ends rather than means: LSE economists on urban containment”).
Demographia World Urban Areas uses base population figures, derived from official census and estimates data, to develop basic year population estimates within the confines of built-up urban areas. These figures are then adjusted to account for population change forecasts, principally from the United Nations or the various national statistics bureaus for a 2018 estimate.
Note 3: Demographia World Urban Areas is a continuing project providing “state of the art” data. Revisions are made as more accurate satellite photographs and population estimating resources become available. As a result, Demographia World Urban Areas is not intended for trend analysis.
Photograph: Cover, 16th Annual Demographia World Urban Areas (Guangzhou: Zhujiang New Town).
Wendell Cox is principal of Demographia, an international public policy firm located in the St. Louis metropolitan area. He is a founding senior fellow at the Urban Reform Institute, Houston and a member of the Advisory Board of the Center for Demographics and Policy at Chapman University in Orange, California. He has served as a visiting professor at the Conservatoire National des Arts et Metiers in Paris. His principal interests are economics, poverty alleviation, demographics, urban policy and transport. He is co-author of the annual Demographia International Housing Affordability Survey and author of Demographia World Urban Areas.
Mayor Tom Bradley appointed him to three terms on the Los Angeles County Transportation Commission (1977-1985) and Speaker of the House Newt Gingrich appointed him to the Amtrak Reform Council, to complete the unexpired term of New Jersey Governor Christine Todd Whitman (1999-2002). He is author of War on the Dream: How Anti-Sprawl Policy Threatens the Quality of Life and Toward More Prosperous Cities: A Framing Essay on Urban Areas, Transport, Planning and the Dimensions of Sustainability.


