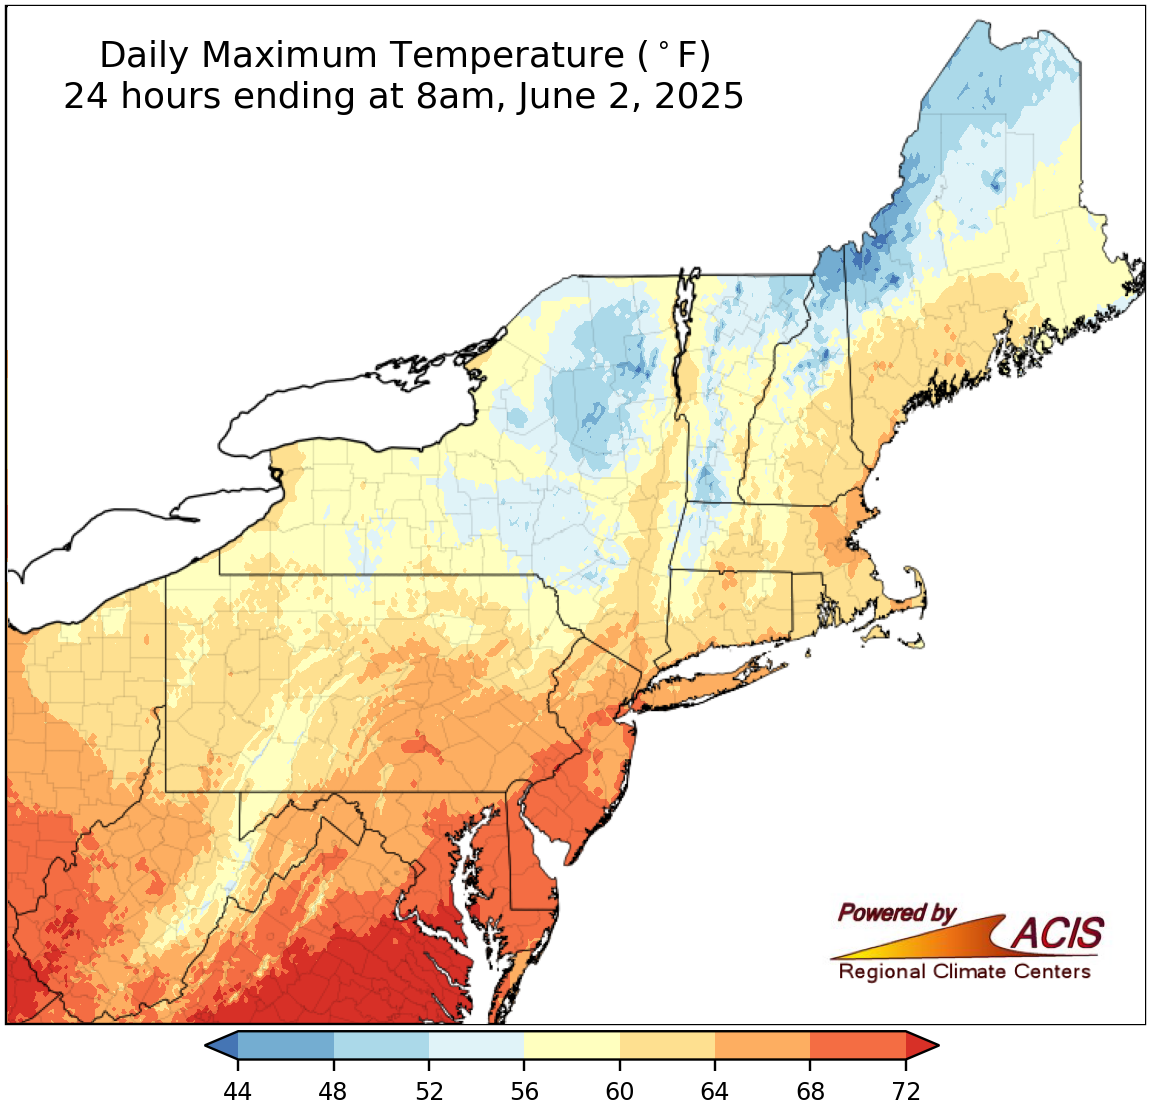
Variable to map:
About High-Resolution Daily Temperature Maps
This map represents daily temperature observations from the National Weather Service (NWS) Cooperative Observer Network. The data have been interpolated to a 5km x 5km grid. Interpolation follows the methods of DeGaetano and Belcher (2007). Daily maximum and minimum temperatures are obtained from the 25 hourly initialization fields of the 40 km resolution NWS Rapid Update Cycle (RUC) model that comprise a 24-hour day. These model data are interpolated to Cooperative Network station locations after standardization to station elevation based on the RUC model temperature lapse rates (a measure of how temperature changes with height in the atmosphere). The resulting tendencies (interpolation and observation) are computed and interpolated back to the RUC grid. This step allows for the daily adjustment of the model's temperatures based on independent observations. The adjusted temperatures are then interpolated to the 5 km grid, after accounting for elevation differences (between the RUC grid and the 5 km grid points), again using the temperature lapse rates given by the model.
A.T. DeGaetano and B.N. Belcher, 2007: Spatial Interpolation of Daily Maximum and Minimum Air Temperature Based on Meteorological Model Analyses and Independent Observations, J. Applied Meteorology and Climatology, 46, 1981.1992.
These maps are updated at 10:45am, 2:45pm and 4:45pm for the current day and redrawn at 1:30pm daily for each of the previous seven days.