(Translated by https://www.hiragana.jp/)
James Webb Space Telescope

Reconnaissance of Potentially Habitable Worlds with NASA’s Webb

Exoplanets are common in our galaxy, and some even orbit in the so-called habitable zone of their star. NASA’s James Webb Space Telescope has been busy observing a few of these small, potentially habitable planets, and astronomers are now hard at work analyzing Webb data. We invite Drs. Knicole Colón and Christopher Stark, two Webb project scientists at NASA’s Goddard Space Flight Center, to tell us more about the challenges in studying these other worlds.

“A potentially habitable planet is often defined as a planet similar in size to Earth that orbits in the ‘habitable zone’ of its star, a location where the planet could have a temperature where liquid water could exist on its surface. We currently know of around 30 planets that may be small, rocky planets like Earth and that orbit in the habitable zone. However, there is no guarantee that a planet that orbits in the habitable zone actually is habitable (it could support life), let alone inhabited (it currently supports life). At the time of writing, there is only one known habitable and inhabited planet – Earth!

This infographic compares the characteristics of three classes of stars in our galaxy: Sunlike stars are classified as G stars; stars less massive and cooler than our Sun are K dwarfs; and even fainter and cooler stars are the reddish M dwarfs. The size of the habitable zone is different for each class of star. In our solar system, the habitable zone begins just beyond the orbit of Venus and almost encompasses Mars. Credits: NASA, ESA and Z. Levy (STScI)

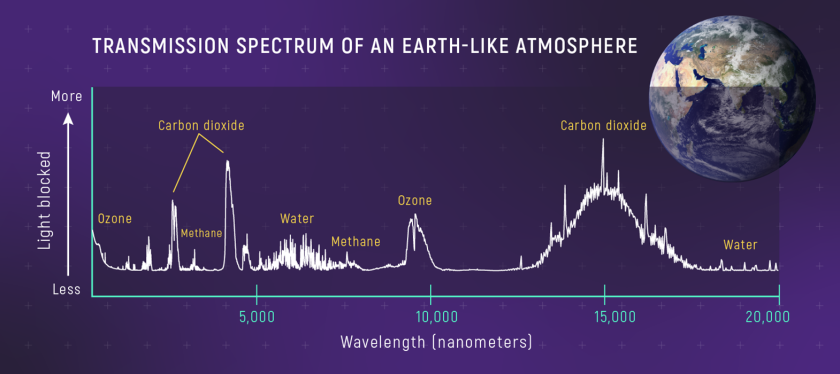
“The potentially habitable worlds Webb is observing are all transiting exoplanets, meaning their orbits are nearly edge-on so that they pass in front of their host stars. Webb takes advantage of this orientation to perform transmission spectroscopy when the planet passes in front of its star. This orientation allows us to examine the starlight filtered through the atmospheres of planets to learn about their chemical compositions. However, the amount of starlight blocked by the thin atmosphere of a small rocky planet is tiny, typically much smaller than 0.02%. Simply detecting an atmosphere around these small worlds is very challenging. Identifying the presence of water vapor, which may bolster the possibility of habitability, is even harder. Searching for biosignatures (biologically produced gases) is extraordinarily difficult, but also an exciting endeavor.

When an exoplanet passes directly between its host star and the observer, we say that the planet is transiting in front of its host star. This transit dims the star’s light by a measurable amount, and starlight is also filtered through the exoplanet’s atmosphere if it has one. This animation shows a single planet and the corresponding change in the light levels during the transit. Credit: NASA’s Jet Propulsion Laboratory

“There are currently only a handful of small, potentially habitable worlds that are considered accessible to atmospheric characterization with Webb, which includes the planets LHS 1140 b and TRAPPIST-1 e.

“Some recent theoretical work exploring the detectability of gaseous molecules in the atmosphere of the super-Earth-size planet LHS 1140 b highlights several challenges in searching for biosignatures. The work notes approximately 10-50 transits of the planet around its host star, equivalent to 40-200 hours of observing time with Webb, would be needed to attempt a detection of potential biosignatures, such as ammonia, phosphine, chloromethane, and nitrous oxide, in the best-case scenario of a clear, cloud-free atmosphere.

“Given that Webb cannot view the LHS 1140 system year-round because of the system’s location on the sky, it would take multiple years if not close to a decade to collect 50 transit observations of LHS 1140 b. Searching for biosignatures may require even more than 50 transit observations if the planet atmosphere is cloudy. Most small exoplanets are known to have clouds or hazes that dampen or obscure the signal being searched for. The atmospheric signals of these biosignature gases also tend to overlap with other expected atmospheric signals (e.g. due to gaseous methane or carbon dioxide), so distinguishing between the various signals is another challenge.

A simulated transmission spectrum of an Earth-like atmosphere shows wavelengths of sunlight that molecules like ozone (O3), water (H2O), carbon dioxide (CO2), and methane (CH4) absorb. (Notice that on this graph, the y-axis shows amount of light blocked by the Earth-like planet’s atmosphere rather than brightness of sunlight that travels through the atmosphere: Brightness decreases from bottom to top.) Model transmission spectrum from Lisa Kaltenegger and Zifan Lin 2021 ApJL 909. Credits: NASA, ESA, Leah Hustak (STScI)

“A potential avenue in the search for biosignatures is in the study of Hycean planets, which are a theoretical class of super-Earth-size planets with a relatively thin hydrogen-rich atmosphere and a substantial liquid water ocean. The super-Earth K2-18 b is a candidate for a potentially habitable Hycean planet based on current data from Webb and other observatories. Recently published work used NIRSpec and NIRISS to detect methane and carbon dioxide in the atmosphere of K2-18 b, but not water. This means the suggestion that K2-18 b is a Hycean world with a liquid water ocean remains based on theoretical models, with no direct observational evidence yet. The authors of the work also hinted at the possible presence of the potential biosignature dimethyl sulfide in the atmosphere of K2-18 b, but the potential dimethyl sulfide signal is too weak for a conclusive detection in the current data. The concept and study of the class of Hycean planets is very new, such that alternative interpretations to the liquid water ocean scenario (and therefore to the potential for a habitable environment) are still being explored. Upcoming Webb observations with the NIRSpec and MIRI instruments should shed further light on the nature of the potential Hycean planet K2-18 b and on the possible presence of dimethyl sulfide in its atmosphere.

“One other confounding factor that makes Webb’s study of small, potentially habitable worlds challenging is that the host stars can exhibit signs of water vapor, too.This was explored in recent Webb observations of the rocky exoplanet known as GJ 486 b. We therefore have the added challenge of determining whether water vapor detected by Webb is actually from a planet’s atmosphere and not from its star.

“The detection of biosignatures in the atmospheres of small, potentially habitable transiting planets that orbit cool stars is an extremely challenging endeavor, typically requiring ideal conditions (e.g., cloud-free atmospheres) or assuming early Earth environments (i.e., different than modern Earth as we know it), the detection of signals significantly smaller than 200 parts per million, a well-behaved star without significant water vapor in star spots, and a significant amount of telescope time to reach sufficient signal-to-noise. It is also important to keep in mind that detection of a single biosignature by any means does not constitute discovery of life. Discovery of life on an exoplanet will likely require a large set of unambiguously detected biosignatures, data from multiple missions and observatories, and extensive atmospheric modeling efforts, a process likely taking years.

“The power of Webb is that it has the sensitivity to detect and begin to characterize the atmospheres of a handful of the most promising potentially habitable planets orbiting cool stars. Webb particularly has the ability to detect a range of molecules important for life, like water vapor, methane, and carbon dioxide. Our goal is to learn as much as we can about worlds that may be potentially habitable, even if we cannot definitively identify habitable signatures with Webb. Webb observations, combined with exoplanet studies by NASA’s upcoming Nancy Grace Roman Space Telescope, will ultimately lay the foundation for the future Habitable Worlds Observatory, which will be NASA’s first mission purpose-built to directly image and search for chemical traces caused by life on Earth-like planets around Sun-like stars.”

About the Authors:

Knicole Colón is an astrophysicist at NASA’s Goddard Space Flight Center in Greenbelt, Maryland, and serves as the James Webb Space Telescope deputy project scientist for Exoplanet Science.

Christopher Stark is an astrophysicist in the Exoplanets and Stellar Astrophysics Laboratory at NASA’s Goddard Space Flight Center in Greenbelt, Maryland, and serves as the James Webb Space Telescope deputy observatory project scientist.


NASA’s James Webb Space Telescope Finds Most Distant Known Galaxy

Editor’s Note: This post highlights data from Webb science in progress, which has not yet been through the peer-review process.

Over the last two years, scientists have used NASA’s James Webb Space Telescope (also called Webb or JWST) to explore what astronomers refer to as Cosmic Dawn –  the period in the first few hundred million years after the big bang where the first galaxies were born. These galaxies provide vital insight into the ways in which the gas, stars, and black holes were changing when the universe was very young. In October 2023 and January 2024, an international team of astronomers used Webb to observe galaxies as part of the JWST Advanced Deep Extragalactic Survey (JADES) program. Using Webb’s NIRSpec (Near-Infrared Spectrograph), they obtained a spectrum of a record-breaking galaxy observed only two hundred and ninety million years after the big bang. This corresponds to a redshift of about 14, which is a measure of how much a galaxy’s light is stretched by the expansion of the universe. We invited Stefano Carniani from Scuola Normale Superiore in Pisa, Italy, and Kevin Hainline from the University of Arizona in Tucson, Arizona, to tell us more about how this source was found and what its unique properties tell us about galaxy formation.

“The instruments on Webb were designed to find and understand the earliest galaxies, and in the first year of observations as part of the JWST Advanced Deep Extragalactic Survey (JADES), we found many hundreds of candidate galaxies from the first 650 million years after the big bang. In early 2023, we discovered a galaxy in our data that had strong evidence of being above a redshift of 14, which was very exciting, but there were some properties of the source that made us wary. The source was surprisingly bright, which we wouldn’t expect for such a distant galaxy, and it was very close to another galaxy such that the two appeared to be part of one larger object. When we observed the source again in October 2023 as part of the JADES Origins Field, new imaging data obtained with Webb’s narrower NIRCam (Near-Infrared Camera) filters pointed even more toward the high-redshift hypothesis. We knew we needed a spectrum, as whatever we would learn would be of immense scientific importance, either as a new milestone in Webb’s investigation of the early universe or as a confounding oddball of a middle-aged galaxy.

Alt text: A field of thousands of small galaxies of various shapes and colors on the black background of space. A bright foreground star with diffraction spikes is at lower left. Near image center, a tiny white box outlines a region and two diagonal lines lead to a larger box in upper right, enlarging the view of this area. Within the box is a banana-shaped blob that is blueish-red in one half and distinctly red in the other half. An arrow points to the redder portion and is labeled “JADES GS z 14 0 .”
This infrared image from NASA’s James Webb Space Telescope (also called Webb or JWST) was taken by the NIRCam (Near-Infrared Camera) for the JWST Advanced Deep Extragalactic Survey, or JADES, program. The NIRCam data was used to determine which galaxies to study further with spectroscopic observations. One such galaxy, JADES-GS-z14-0 (shown in the pullout), was determined to be at a redshift of 14.32 (+0.08/-0.20), making it the current record-holder for the most distant known galaxy. This corresponds to a time less than 300 million years after the big bang.
In the background image, blue represents light at 0.9, 1.15, and 1.5 microns (filters F090W + F115W + F150W), green is 2.0 and 2.77 microns (F200W + F277W), and red is 3.56, 4.1, and 4.44 microns (F356W + F410M + F444W). The pullout image shows light at 0.9 and 1.15 microns (F090W + F115W) as blue, 1.5 and 2.0 microns (F150W + F200W) as green, and 2.77 microns (F277W) as red.
Credit: NASA, ESA, CSA, STScI, Brant Robertson (UC Santa Cruz), Ben Johnson (CfA), Sandro Tacchella (Cambridge), Phill Cargile (CfA)

“In January 2024, NIRSpec observed this galaxy, JADES-GS-z14-0, for almost ten hours, and when the spectrum was first processed, there was unambiguous evidence that the galaxy was indeed at a redshift of 14.32, shattering the previous most-distant galaxy record (z = 13.2 of JADES-GS-z13-0). Seeing this spectrum was incredibly exciting for the whole team, given the mystery surrounding the source. This discovery was not just a new distance record for our team; the most important aspect of JADES-GS-z14-0 was that at this distance, we know that this galaxy must be intrinsically very luminous. From the images, the source is found to be over 1,600-light years across, proving that the light we see is coming mostly from young stars and not from emission near a growing supermassive black hole. This much starlight implies that the galaxy is several hundreds of millions of times the mass of the Sun! This raises the question: How can nature make such a bright, massive, and large galaxy in less than 300 million years?

“The data reveal other important aspects of this astonishing galaxy. We see that the color of the galaxy is not as blue as it could be, indicating that some of the light is reddened by dust, even at these very early times. JADES researcher Jake Helton of Steward Observatory and the University of Arizona also identified that JADES-GS-z14-0 was detected at longer wavelengths with Webb’s MIRI (Mid-Infrared Instrument), a remarkable achievement considering its distance. The MIRI observation covers wavelengths of light that were emitted in the visible-light range, which are redshifted out of reach for Webb’s near-infrared instruments. Jake’s analysis indicates that the brightness of the source implied by the MIRI observation is above what would be extrapolated from the measurements by the other Webb instruments, indicating the presence of strong ionized gas emission in the galaxy in the form of bright emission lines from hydrogen and oxygen. The presence of oxygen so early in the life of this galaxy is a surprise and suggests that multiple generations of very massive stars had already lived their lives before we observed the galaxy.

Alt text: A graph labeled “Galaxy JADES GS z 14 0, Galaxy existed 300 million years after big bang, NIRSpec microshutter array spectroscopy.” The x-axis is labeled “Wavelength of Light, microns” and extends from about 0.5 microns to 5.5 microns, with tick marks every 0.5 microns from 1.0 to 5.0. The y-axis is labeled “Brightness” and has a zero mark with a horizontal, dashed line about a third of the way up from the bottom. An up arrow is labeled “brighter.” A jagged orange line runs horizontally across the graph. It fluctuates above and below the zero line until reaching a wavelength of about 1.9 microns, at which point it peaks before gradually decreasing again, but remaining above the zero line. The wavelength where the emission peaks has a vertical red line labeled “Lyman-alpha break, z = 14.32.”
Scientists used NASA’s James Webb Space Telescope’s NIRSpec (Near-Infrared Spectrograph) to obtain a spectrum of the distant galaxy JADES-GS-z14-0 in order to accurately measure its redshift and therefore determine its age. The redshift can be determined from the location of a critical wavelength known as the Lyman-alpha break. This galaxy dates back to less than 300 million years after the big bang.
Credit: NASA, ESA, CSA, Joseph Olmsted (STScI). Science: S. Carniani (Scuola Normale Superiore), JADES Collaboration.

“All of these observations, together, tell us that JADES-GS-z14-0 is not like the types of galaxies that have been predicted by theoretical models and computer simulations to exist in the very early universe. Given the observed brightness of the source, we can forecast how it might grow over cosmic time, and so far we have not found any suitable analogs from the hundreds of other galaxies we’ve observed at high redshift in our survey. Given the relatively small region of the sky that we searched to find JADES-GS-z14-0, its discovery has profound implications for the predicted number of bright galaxies we see in the early universe, as discussed in another concurrent JADES study (Robertson et al., recently accepted). It is likely that astronomers will find many such luminous galaxies, possibly at even earlier times, over the next decade with Webb. We’re thrilled to see the extraordinary diversity of galaxies that existed at Cosmic Dawn!”

These spectroscopic observations were taken as part of Guaranteed Time Observations (GTO) program 1287, and the MIRI ones as part of GTO program 1180.

About the authors:
Stefano Carniani is an assistant professor at Scuola Normale Superiore in Italy. He is also a member of the Webb/NIRSpec GTO team and studies galaxy and black hole evolution across cosmic time.

Kevin Hainline is an associate research professor at the Steward Observatory, University of Arizona. He is also a member of the Webb/NIRCam Science team, and is using data from the JADES GTO survey to explore the evolution of galaxies and active galactic nuclei at the highest redshifts.

News Media Contacts:

Alise Fisher
Headquarters, Washington
202-358-2546
alise.m.fisher@nasa.gov

Laura Betz
Goddard Space Flight Center, Greenbelt, Md.
301-286-9030
laura.e.betz@nasa.gov

Christine Pulliam
Space Telescope Science Institute, Baltimore, Md.
410-338-4366
cpulliam@stsci.edu

NASA’s Webb Makes the Distant Universe Dream Come True

NASA’s James Webb Space Telescope is delivering on its promise to explore the farthest reaches of the universe, looking back to a time when galaxies were just beginning to form. Scientists have been eagerly waiting to use this complex observatory to understand details that have been out of reach. We invite Alan Dressler, astronomer emeritus at the Carnegie Institute for Science Observatories, to describe his journey of scientific discovery from the early days of NASA’s Hubble Space Telescope to the exciting, new era of astronomy with the James Webb Space Telescope.

“In 1993 I was asked by AURA – the Associated Universities of Research in Astronomy – to lead a committee of 20 astronomers in identifying the important questions astronomers might answer in the next 20 years, given the astonishing and surprisingly deep view of the universe from the Hubble Space Telescope (HST). Astronomers had expected Hubble might be able to ‘look back in time’ to when the universe was half its present age of 13.8 billion years, or around 7 billion years ago. This by itself was an exciting prospect, but Hubble did far better, discovering that light from distant galaxies was brighter – and more intense – than expected. Our HST & Beyond committee realized that Hubble could take us to the threshold of the actual birth of galaxies, within the billion years after the big bang. This was a ‘once-in-a-species’ opportunity to witness our own cosmic origins.

“Without galaxies to host generations of stars and accumulate the heavy chemical elements that are essential ingredients in planets – and life – our universe would have fizzled. However, to actually see galaxy births would require something beyond Hubble: a bigger telescope, with extreme sensitivity to infrared light. The HST & Beyond committee advised NASA to build such a telescope – an extraordinary challenge, because only a super-cold telescope placed far from Earth could see the faint glow of these cosmic cradles. It took 25 years and nearly 20,000 smart, dedicated people, but the James Webb Space Telescope has done it! Since the start of science observations in July 2022, different programs use the telescope to take pictures of galaxies in the throes of birth, more than 13 billion years ago. And there has been a great surprise! Galaxies were born in explosive bursts of star formation – unlike anything that we have ever seen.

“I had hoped that I might share in this epic journey – so long in coming – and fortunately, I have. The team that built Webb’s NIRCam (Near-Infrared Camera), the telescope’s primary camera, has taken extremely deep pictures in nine infrared colors with its Guaranteed Time Observations program called JWST Advanced Deep Extragalactic Survey (JADES). JADES surveyed the southern portion of the Great Observatories Origins Deep Survey (GOODS), a region of the sky used to perform deep astronomical surveys. This GOODS-South field is wide enough to capture about 1,000 galaxies of the universe’s first billion years. This was the time when rapid expansion of the universe had cooled it enough for gravity to pull together hydrogen and helium gas, enabling the birth of the first stars. This first generation will be very hard to detect (and may be undetectable – even with Webb), but we are seeing the second-generation stars that did the ‘major lifting’ of chemical enrichment.

This NIRCam image from NASA’s James Webb Space Telescope was taken for the JWST Advanced Deep Extragalactic Survey, or JADES, program. It shows a portion of an area of the sky known as GOODS-South, which has been well studied by NASA’s Hubble Space Telescope and other observatories. More than 45,000 galaxies are visible here. In this image, blue, green, and red were assigned to Webb’s NIRCam data at 0.9, 1.15, and 1.5 microns; 2.0, 2.77, and 3.35 microns; and 3.56, 4.1, and 4.44 microns (F090W, F115W, and F150W; F200W, F277W, and F335M; and F356W, F410M, and F444W), respectively.
Credits: NASA, ESA, CSA, Brant Robertson (UC Santa Cruz), Ben Johnson (CfA), Sandro Tacchella (Cambridge), Marcia Rieke (University of Arizona), Daniel Eisenstein (CfA).

“Galaxies ‘grow’ by turning the (mostly hydrogen) gas into generations of stars – adding stellar mass. Today’s galaxies do this slowly – not much gas is left. However, astronomers suspected that, in the gas-rich early universe, growth would be rapid and dynamic, and that has turned out to be quite an understatement. As a population of stars ages, their combined light turns from blue to red: Astronomers have long struggled to distinguish a relatively young galaxy from a much older one, because a population of stars that is 2 billion years old is already just as ‘red’ as another galaxy that is 10 billion years old. This is like judging the age of people only from their height. But here is where things turn to our favor: The observatory is showing us galaxies from the first billion years – extremely young, where the light comes from stars about twice as massive, and much bluer, than our Sun. These so-called A-stars are fantastic ‘cosmic clocks,’ with lifetimes between 100 million years and 1 billion years. Over a billion years it’s easy to tell the youngest from the oldest. We use them to decode the histories of star formation of the first galaxies.

“These NIRCam pictures record the infrared colors of the combined light of these young stars.  To understand the astrophysics, astronomers prefer to spread starlight into a highly detailed  ‘rainbow,’ called a spectrum, with hundreds, or thousands, of colors in it. But the first galaxies are too faint for that, so instead we use a ‘simple rainbow’ of seven colors obtained from NIRCam images taken with different filters to analyze the age and history of each galaxy.  Astronomers call this ‘simple rainbow’ the ‘spectral energy distribution or SED.   

“Over several years l developed a computer code – SEDz* – that analyzes seven-color SEDs to extract a galaxy’s history of star formation. The figure below shows how the distinct SEDs of young stellar populations are used to measure star formation histories. The top left panel shows the SED (the data) of a faint galaxy and the model that SEDz* produces by combining the light of stellar populations that, added together, describe the galaxy’s history of star formation. The SEDz* solution includes measuring the redshift of the galaxy (the ‘when’) – the red-ward shift of light due to the expansion of the universe (why we look in the infrared to see these first galaxies). SEDz* solves for the combination of populations of stars – how much mass at what age? – best matches the data. For every well-observed galaxy, only one combination of stellar population ages – one star formation history – ‘works.’ In some cases, comparatively few stars – too few to detect – are born in the roughly 500 million years in-between, so we describe these as bursts of rapid and intense star formation – starbursts.

The left box shows the data and the SEDz* “solution” – how much star formation at which times – matches the data. This galaxy has a redshift of z~6, almost 13 billion years ago, about 1 billion years after the big bang. The run of seven black dots (with crossbars – the errors) are the data – the measured brightness (or flux) of the galaxy in each infrared color. The SEDz* solution tells the star formation history – the buildup of stellar mass, recorded in the right box. This history is a mass of 350 million “suns” born at z = 11, when the universe was only 350 million years old, and 180 million “suns” born 600 million years later. They combine to make the magenta band that passes through all the data points (right panel) – an excellent fit. The early burst (orange curve) and later burst (purple curve) have together matched the “shape” of the data. Comparatively few stars – too few to detect – are born in the roughly 500 million years in-between, so we describe these as bursts of rapid and intense star formation – starbursts. Credit: Alan Dressler

“The astonishing thing is that, together, such bursts are found for more than 70% of the roughly 900 galaxies in the sample. About half of all histories in this study are single bursts – meaning that all the stars combined, having 100 million up to 1 billion times the mass of our Sun, are born in a time of about 100 million years, and probably much less. There are no starbursts of this magnitude occurring in the modern universe, or even in the previous 10 billion years that led to our time. These early starbursts easily surpass any we’ve ever seen, and computer models of how galaxies were built did not predict them. The challenge for theorists will be to understand the physics that allow – actually ‘require’ – such violent events to kick things off.

“Below are two more examples, a single starburst, and an infant galaxy growing smoothly and steadily – more like what we expected for most of them. Such longer histories that spread over the first billion years are outnumbered three to one by the bursts, but each of these ‘steady builders’ accumulate considerable stellar mass, so they substantially contribute to building today’s population of galaxies, like our own Milky Way.

These two examples are animated, showing how SEDz* operates. For each, and for all of the roughly 900 galaxies, the program starts with star formation at only the earliest epoch, z = 12, demonstrating that, with only the earliest stellar populations, this first attempt fails, but as later populations are added (z=11, z=10, z=9…) the match improves, until a combination of these inevitably emerges as a good or even great fit to the SED. However, as the first animation shows, sometimes only a single-age population, or maybe two bursts, like the one in the first figure, is all that is needed – indeed, all that can be accommodated – to match the observed SED. That’s true for about 70% of the sample. Credit: Alan Dressler.

“The early universe of galaxies began in a fury of what might be called ‘explosive star formation,’ with only a modest fraction of galaxies growing in a slower, steadier pace. In the billion years that follow, these burst galaxies must grow about 10 times in stellar mass. That much we know. How they do it? That we surely don’t. And that’s the challenge.”

About the Author

Alan Dressler is a staff scientist emeritus at the Carnegie Institution for Science in Washington. He studies how galaxy structures and shapes change, the pace and character of star birth, and how large galaxies form from earlier, smaller systems. The findings in this blog were published in the March 27, 2024 issue of The Astrophysical Journal.


Supernova Encore: NASA’s Webb Spots a Second Lensed Supernova in a Distant Galaxy

Editor’s Note: This post highlights data from Webb science in progress, which has not yet been through the peer-review process.

In November 2023, NASA’s James Webb Space Telescope observed a massive cluster of galaxies named MACS J0138.0-2155. Through an effect called gravitational lensing, first predicted by Albert Einstein, a distant galaxy named MRG-M0138 appears warped by the powerful gravity of the intervening galaxy cluster. In addition to warping and magnifying the distant galaxy, the gravitational lensing effect caused by MACS J0138 produces five different images of MRG-M0138.

In 2019, astronomers announced the surprising find that a stellar explosion, or supernova, had occurred within MRG-M0138, as seen in images from NASA’s Hubble Space Telescope taken in 2016. When another group of astronomers examined the 2023 Webb images, they were astonished to find that seven years later, the same galaxy is home to a second supernova. Justin Pierel (NASA Einstein Fellow at the Space Telescope Science Institute) and Andrew Newman (staff astronomer at the Observatories of the Carnegie Institution for Science) tell us more about this first time that two gravitationally lensed supernovae were found in the same galaxy.

NASA’s James Webb Space Telescope has spotted a multiply-imaged supernova in a distant galaxy designated MRG-M0138. Two images of the supernova (circled) are seen in the Webb NIRCam (Near-Infrared Camera) image above, but an additional supernova image is expected to become visible around 2035. In this image blue represents light at 1.15 and 1.5 microns (F115W+F150), green is 2.0 and 2.77 microns (F200W+277W), and red is 3.56 and 4.44 microns (F356W + F444W). Credit: NASA, ESA, CSA, STScI, Justin Pierel (STScI) and Andrew Newman (Carnegie Institution for Science). Download the full-resolution image, both labeled and unlabeled from the Space Telescope Science Institute.

“When a supernova explodes behind a gravitational lens, its light reaches Earth by several different paths. We can compare these paths to several trains that leave a station at the same time, all traveling at the same speed and bound for the same location. Each train takes a different route, and because of the differences in trip length and terrain, the trains do not arrive at their destination at the same time. Similarly, gravitationally lensed supernova images appear to astronomers over days, weeks, or even years. By measuring differences in the times that the supernova images appear, we can measure the history of the expansion rate of the universe, known as the Hubble constant, which is a major challenge in cosmology today. The catch is that these multiply-imaged supernovae are extremely rare: fewer than a dozen have been detected until now.

“Within this small club, the 2016 supernova in MRG-M0138, named Requiem, stood out for several reasons. First, it was 10 billion light-years distant. Second, the supernova was likely the same type (Ia) that is used as a ‘standard candle’ to measure cosmic distances. Third, models predicted that one of the supernova images is so delayed by its path through the extreme gravity of the cluster that it will not appear to us until the mid-2030s. Unfortunately, since Requiem was not discovered until 2019, long after it had faded from view, it was not possible to gather sufficient data to measure the Hubble constant then.

Left: In 2016 NASA’s Hubble Space Telescope spotted a multiply imaged supernova, nicknamed Supernova Requiem, in a distant galaxy lensed by the intervening galaxy cluster MACS J0138. Three images of the supernova are visible, and a fourth image is expected to arrive in 2035. In this near-infrared image, light at 1.05 microns is represented in blue and 1.60 microns is orange. Right: In November 2023 NASA’s James Webb Space Telescope identified a second multiply imaged supernova in the same galaxy using its NIRCam (Near-Infrared Camera) instrument. This is the first known system to produce more than one multiply-imaged supernova. Hubble image credit: NASA, ESA, STScI, Steve A. Rodney (University of South Carolina) and Gabriel Brammer (Cosmic Dawn Center/Niels Bohr Institute/University of Copenhagen); JWST image credit: NASA, ESA, CSA, STScI, Justin Pierel (STScI) and Andrew Newman (Carnegie Institution for Science). Download the full-resolution image from the Space Telescope Science Institute.

“Now we have found a second gravitationally lensed supernova within the same galaxy as Requiem, which we call Supernova Encore. Encore was discovered serendipitously, and we are now actively following the ongoing supernova with a time-critical director’s discretionary program. Using these Webb images, we will measure and confirm the Hubble constant based on this multiply imaged supernova. Encore is confirmed to be a standard candle or type Ia supernova, making Encore and Requiem by far the most distant pair of standard-candle supernova ‘siblings’ ever discovered.

“Supernovae are normally unpredictable, but in this case we know when and where to look to see the final appearances of Requiem and Encore. Infrared observations around 2035 will catch their last hurrah and deliver a new and precise measurement of the Hubble constant.”

These observations were taken as part of Webb Director’s Discretionary Time program 6549.

About the Authors:

Justin Pierel is a NASA Einstein Fellow at the Space Telescope Science Institute in Baltimore, Maryland, and co-principal investigator of the Webb Director’s Discretionary Time program 6549.

Andrew Newman is a staff astronomer at the Observatories of the Carnegie Institution for Science in Pasadena, California. He is principal investigator of Webb General Observer program 2345, which discovered Supernova Encore, and co-principal investigator of the Webb Director’s Discretionary Time program 6549.


Measuring the Distances to Galaxies With Space Telescopes

One of NASA’s James Webb Space Telescope’s science goals is to understand how galaxies in the early universe formed and evolved into much larger galaxies like our own Milky Way. This goal requires that we identify samples of galaxies at different moments in the universe’s history to explore how their properties evolve with time.

We asked Micaela Bagley, a postdoctoral fellow at the University of Texas at Austin, to explain how astronomers analyze light from distant galaxies and determine “when in the universe’s history” we are observing them.

“Light takes time to travel through space. When light from a distant galaxy (or any object in space) reaches us, we are seeing that galaxy as it appeared in the past. To determine the  ‘when’ in the past, we use the galaxy’s redshift.

“Redshift tells us how long the light has spent being stretched to longer wavelengths by the expansion of the universe as it travels to reach us. We can calculate the redshift using features in the galaxy’s spectrum, which is an observation that spreads out the light from a target by wavelength, essentially sampling the light at very small intervals. We can measure the emission lines and spectral breaks (abrupt changes in the light intensity at specific wavelengths), and compare their observed wavelengths with their known emitted wavelengths.

“One of the most efficient ways to identify galaxies is through imaging, for example with the observatory’s NIRCam (Near-Infrared Camera) instrument. We take images using multiple filters to collect the object’s light in several different colors. When we measure a galaxy’s photometry, or how bright it is in an image, we’re measuring the brightness of the object averaged across the full range of wavelengths transmitted by the filter. We can observe a galaxy with NIRCam’s broadband imaging filters, but there is a lot of detailed information hidden within each single measurement for every 0.3–1.0 microns in wavelength coverage.

“Yet we can start to constrain the shape of a galaxy’s spectrum. The spectrum’s shape is affected by several properties including how many stars are forming in the galaxy, how much dust is present within it, and how much the galaxy’s light has been redshifted. We compare the measured brightness of the galaxy in each filter to the predicted brightness for a set of galaxy models spanning a range of those properties at a range of redshifts. Based on how well the models fit the data, we can determine the probability that the galaxy is at a given redshift or ‘ moment in history.’ The best-fitting redshift determined through this analysis is called the photometric redshift.

An illustration of measuring a photometric redshift using six broadband imaging filters (left panel). A model galaxy spectrum with a strong spectral break and several emission lines is shown in gray. The wavelength at which the light was emitted and observed is listed along the top and bottom, respectively. The light has been redshifted (or stretched out) by a factor of 10. The NIRCam filter transmissions and wavelength coverages are shown by the colored shaded regions. We measure the average flux in each filter (circles) and fit these six data points with different galaxy models at a range of redshifts to determine the probability that the galaxy is at each redshift. The galaxy has a best-fit photometric redshift of 9 (when the universe was 550 million years old), but the probability distribution (right panel) covers the redshift range of 7-11 (when the universe was between 420 to 770 million years old.) Credit: Micaela Bagley

“In July 2022, teams used NIRCam images from the CEERS Survey to identify two galaxies with photometric redshifts greater than 11 (when the universe was less than 420 million years old.) Neither of these objects were detected by NASA’s Hubble Space Telescope observations in this field because they are either too faint or are detectable only at wavelengths outside of Hubble’s sensitivity. These were very exciting discoveries with the new telescope!

Two galaxies discovered in early NIRCam imaging with photometric redshifts of 11.5 and 16.4 (when the universe was about 390 and 240 million years old, respectively). For each galaxy, the teams show image cutouts in all available filters along the top, the observed photometry, the best-fitting galaxy model, and the photometric redshift probability distribution as an inset. Credit: Top panel – Finkelstein et al. (2023) ; Bottom panel – Donnan et al. (2023) .

“However, photometric redshift of a galaxy is somewhat uncertain. For example, we may be able to determine that a spectral break is present in a filter, but not the precise wavelength of the break. While we can estimate a best-fit redshift based on modeling the photometry, the resulting probability distribution is often broad. Additionally, galaxies at different redshifts can have similar colors in broadband filters, making it difficult to distinguish their redshifts based only on photometry. For example, red, dusty galaxies at redshifts less than 5 (or when the universe was 1.1 billion years old or older) and cool stars in our own galaxy can sometimes mimic the same colors of a high-redshift galaxy. We therefore consider all galaxies that are selected based on their photometric redshifts to be high-redshift candidates until we can obtain a more precise redshift.

“We can determine a more precise redshift for a galaxy by obtaining a spectrum. As illustrated in the following figure, our calculation of the redshift probability distribution improves as we measure the photometry of a galaxy in ever finer wavelength steps. The probability distribution narrows as we move from using broadband filters for imaging (top) to a larger number of narrower filters (middle), to a spectrum (bottom). In the bottom row we can start to key off specific features like the spectral break on the far left and emission lines to obtain a redshift probability distribution that is very precise – a spectroscopic redshift.

An illustration of how the redshift probability distribution (right panels) narrows as we measure the photometry of a galaxy (left panels) in ever finer wavelength steps. (Credit: Micaela Bagley)

“In February 2023, the CEERS teams followed up their high-redshift candidates with observatory’s NIRSpec (Near-Infrared Spectrograph) instrument to measure precise, spectroscopic redshifts. One candidate (Maisie’s Galaxy) has been confirmed to be at redshift 11.4 (when the universe was 390 million years old), while the second candidate was discovered to actually be at a lower redshift of 4.9 (when the universe was 1.2 billion years old.)

Spectroscopic observations with the NIRSpec instrument of the two galaxy candidates at redshifts 11.5 and 16.4. The top row shows Maisie’s Galaxy at left, which is confirmed to be at a redshift of 11.44 (or when the universe was about 390 million years old). This redshift is based on the detection of the spectral break marked by the dotted vertical red line in right figure in the upper row in the NIRSpec spectrum. The bottom row shows the candidate from Donnan et al. (2023), which is found to be at a redshift of 4.9 from strong doubly ionized oxygen ([OIII]) and hydrogen (Hαあるふぁ) emission lines. Credit: Figures 2 and 3 from Arrabal Haro et al. (2023)
“Even cases where we discover that a high-redshift candidate is actually a lower redshift galaxy can be very exciting. They allow us to learn more about conditions in galaxies and the way those conditions affect their photometry, to improve our models of galaxy spectra, and to constrain galaxy evolution across all redshifts. However, they also highlight the need to obtain spectra to confirm high-redshift candidates.

About the author:

Micaela Bagley is a postdoctoral fellow at the University of Texas at Austin and a member of CEERS. They study galaxy formation and evolution in the early universe. Micaela is also responsible for processing all the NIRCam images for the CEERS team.


NASA’s Webb Identifies Methane In an Exoplanet’s Atmosphere

NASA’s James Webb Space Telescope observed the exoplanet WASP-80 b as it passed in front of and behind its host star, revealing spectra indicative of an atmosphere containing methane gas and water vapor. While water vapor has been detected in over a dozen planets to date, until recently methane – a molecule found in abundance in the atmospheres of Jupiter, Saturn, Uranus, and Neptune within our solar system – has remained elusive in the atmospheres of transiting exoplanets when studied with space-based spectroscopy. Taylor Bell from the Bay Area Environmental Research Institute (BAERI), working at NASA’s Ames Research Center in California’s Silicon Valley, and Luis Welbanks from Arizona State University tell us more about the significance of discovering methane in exoplanet atmospheres and discuss how Webb observations facilitated the identification of this long-sought-after molecule. These findings were recently published in the scientific journal Nature.

An artists rendering of a blue and white exoplanet known as WASP-80 b, set on a star-studded black background. Alternating horizontal layers of cloudy white, grey and blue cover the planets surface. To the right of the planet, a rendering of the chemical methane is depicted with four hydrogen atoms bonded to a central carbon atom, representing methane within the exoplanet's atmosphere.
An artist’s rendering of the warm exoplanet WASP-80 b whose color may appear bluish to human eyes due to the lack of high-altitude clouds and the presence of atmospheric methane identified by NASA’s James Webb Space Telescope, similar to the planets Uranus and Neptune in our own solar system. Image credit: NASA.

“With a temperature about 825 kelvins (about 1,025 degrees Fahrenheit), WASP-80 b is what scientists call a “warm Jupiter,” which are planets that are similar in size and mass to the planet Jupiter in our solar system but have a temperature that’s in-between that of hot Jupiters, like the 1,450-K (2,150-F) HD 209458 b (the first transiting exoplanet discovered), and cold Jupiters, like our own which is about 125 K (235 F). WASP-80 b goes around its red dwarf star once every three days and is situated 163 light-years away from us in the constellation Aquila. Because the planet is so close to its star and both are so far away from us, we can’t see the planet directly with even the most advanced telescopes like Webb. Instead, researchers study the combined light from the star and planet using the transit method (which has been used to discover most known exoplanets), and the eclipse method.

Using the transit method, we observed the system when the planet moved in front of its star from our perspective, causing the starlight we see to dim a bit. It’s kind of like when someone passes in front of a lamp and the light dims. During this time, a thin ring of the planet’s atmosphere around the planet’s day/night boundary is lit up by the star, and at certain colors of light where the molecules in the planet’s atmosphere absorb light, the atmosphere looks thicker and blocks more starlight, causing a deeper dimming compared to other wavelengths where the atmosphere appears transparent. This method helps scientists like us understand what the planet’s atmosphere is made of by seeing which colors of light are being blocked.

Meanwhile, using the eclipse method, we observed the system as the planet passed behind its star from our perspective, causing another small dip in the total light we received. All objects emit some light, called thermal radiation, with the intensity and color of the emitted light depending on how hot the object is. Just before and after the eclipse, the planet’s hot dayside is pointed toward us, and by measuring the dip in light during the eclipse we were able to measure the infrared light emitted by the planet. For eclipse spectra, absorption by molecules in the planet’s atmosphere typically appear as a reduction in the planet’s emitted light at specific wavelengths. Also, since the planet is much smaller and colder than its host star, the depth of an eclipse is much smaller than the depth of a transit.

Graphic titled “Warm Gas Giant Exoplanet WASP-80 b, Atmospheric Composition. NIRCam Grism Spectroscopy.” Below are two graphs. The first graph generally slopes down, while the second graph slopes up. Their data were taken from two different methods, the transit method (top graph) and the eclipse method (bottom graph). The x-axis for both is labeled “Wavelength of light (microns).” It runs from 2.4 to 4.0 microns in increments of 0.2. The y-axis for the transit graph is labeled “Amount of starlight blocked,” and it runs from 2.88% to 3.00%. The eclipse graph’s y-axis is “Amount of planetary light emitted” and goes from 0.00% to 0.12%. Both graphs are plotted with white dots that have error bars running through them. There are clear signatures of water vapor (highlighted in green) and methane (highlighted in purple).
The measured transit spectrum (top) and eclipse spectrum (bottom) of WASP-80 b from NIRCam’s slitless spectroscopy mode on NASA’s James Webb Space Telescope. In both spectra, there is clear evidence for absorption from water and methane whose contributions are indicated with colored contours. During a transit, the planet passes in front of the star, and in a transit spectrum, the presence of molecules makes the planet’s atmosphere block more light at certain colors, causing a deeper dimming at those wavelengths. During an eclipse, the planet passes behind the star, and in this eclipse spectrum, molecules absorb some of the planet’s emitted light at specific colors, leading to a smaller dip in brightness during the eclipse compared to a transit. Image Credit: BAERI/NASA/Taylor Bell.

The initial observations we made needed to be transformed into something we call a spectrum; this is essentially a measurement showing how much light is either blocked or emitted by the planet’s atmosphere at different colors (or wavelengths) of light. Many different tools exist to transform raw observations into useful spectra, so we used two different approaches to make sure our findings were robust to different assumptions. Next, we interpreted this spectrum using two kinds of models to simulate what the atmosphere of a planet under such extreme conditions would look like. The first type of model is entirely flexible, trying millions of combinations of methane and water abundances and temperatures to find the combination that best matches our data. The second type, called ‘self-consistent models,’ also explores millions of combinations but uses our existing knowledge of physics and chemistry to determine the levels of methane and water that could be expected. Both model types reached the same conclusion: a definitive detection of methane.

To validate our findings, we used robust statistical methods to evaluate the probability of our detection being random noise. In our field, we regard the ‘gold standard’ to be something called a ‘5-sigma detection,’ meaning the odds of a detection being caused by random noise are 1 in 1.7 million. Meanwhile, we detected methane at 6.1-sigma in both the transit and eclipse spectra, which sets the odds of a spurious detection in each observation at 1 in 942 million, surpassing the 5-sigma ‘gold standard,’ and reinforcing our confidence in both detections.

With such a confident detection, not only did we find a very elusive molecule, but we can now start exploring what this chemical composition tells us about the planet’s birth, growth, and evolution. For example, by measuring the amount of methane and water in the planet, we can infer the ratio of carbon atoms to oxygen atoms. This ratio is expected to change depending on where and when planets form in their system. Thus, examining this carbon-to-oxygen ratio can offer clues as to whether the planet formed close to its star or farther away before gradually moving inward.

Another thing that has us excited about this discovery is the opportunity to finally compare planets outside of our solar system to those in it. NASA has a history of sending spacecraft to the gas giants in our solar system to measure the amount of methane and other molecules in their atmospheres. Now, by having a measurement of the same gas in an exoplanet, we can start to perform an “apples-to-apples” comparison and see if the expectations from the solar system match what we see outside of it.

Finally, as we look toward future discoveries with Webb, this result shows us that we are at the brink of more exciting findings. Additional MIRI and NIRCam observations of WASP-80 b with Webb will allow us to probe the properties of the atmosphere at different wavelengths of light. Our findings lead us to think that we will be able to observe other carbon-rich molecules such as carbon monoxide and carbon dioxide, enabling us to paint a more comprehensive picture of the conditions in this planet’s atmosphere. Additionally, as we find methane and other gases in exoplanets, we will continue to expand our knowledge about how chemistry and physics works under conditions unlike what we have on Earth, and maybe sometime soon, in other planets that remind us of what we have here at home. One thing is clear – —the journey of discovery with the James Webb Space Telescope is brimming with potential surprises.”

About the authors:

      • Taylor Bell is a postdoctoral research scientist at the Bay Area Environmental Research Institute (BAERI), working at NASA’s Ames Research Center in California’s Silicon Valley.
      • Luis Welbanks is a NASA Hubble Fellow at Arizona State University in Tempe, Arizona.

Webb Confirms Accuracy of Universe’s Expansion Rate Measured by Hubble, Deepens Mystery of Hubble Constant Tension

The rate at which the universe is expanding, known as the Hubble constant, is one of the fundamental parameters for understanding the evolution and ultimate fate of the cosmos. However, a persistent difference called the “Hubble Tension” is seen between the value of the constant measured with a wide range of independent distance indicators and its value predicted from the big bang afterglow.

A large galaxy takes up the entirety of the image. The galaxy has a bright white core, and several large spiral arms extending out from that core, rotating clockwise. The arms are light blue with many pink speckles and clumps littering the arms. The background is also filled with a smattering of white and pink dots.
Combined observations from NASA’s NIRCam (Near-Infrared Camera) and Hubble’s WFC3 (Wide Field Camera 3) show spiral galaxy NGC 5584, which resides 72 million light-years away from Earth. Among NGC 5584’s glowing stars are pulsating stars called Cepheid variables and Type Ia supernova, a special class of exploding stars. Astronomers use Cepheid variables and Type Ia supernovae as reliable distance markers to measure the universe’s expansion rate.
Download the high-resolution file from the Resource Gallery.
Credit: NASA, ESA, CSA, and A. Riess (STScI).

NASA’s James Webb Space Telescope provides new capabilities to scrutinize and refine some of the strongest observational evidence for this tension. Nobel Laureate Adam Riess from the Johns Hopkins University and the Space Telescope Science Institute presents his and his colleagues’ recent work using Webb observations to improve the precision of local measurements of the Hubble constant.

“Did you ever struggle to see a sign that was at the edge of your vision? What does it say? What does it mean? Even with the most powerful telescopes, the ‘signs’ astronomers want to read appear so small that we struggle too.

“The sign cosmologists want to read is a cosmic speed limit sign that tells us how fast the universe is expanding — a number called the Hubble constant. Our sign is written into the stars in distant galaxies. The brightnesses of certain stars in those galaxies tell us how far away they are and thus for how much time this light has been traveling to reach us, and the redshifts of the galaxies tell us how much the universe expanded over that time, hence telling us the expansion rate.

Graphic titled “Uncrowding Cepheids in the Near-Infrared.” Left: Colorful image of a spiral galaxy is labeled “NGC 5584 (Webb NIRCam + Hubble WFC3).” Part of a spiral arm is outlined with a box. Inside the box is a solid red circle. Middle: Set of two diagrams illustrating zoomed-in views of the boxed region. Top diagram shows Hubble pointing toward a large transparent box. Long edge of the base is labeled “depth.” Box contains numerous overlapping, blue-green spheres of different sizes, with a red sphere near the middle. Bottom diagram shows Webb pointing toward an almost identical box. Spheres in this box are significantly smaller and there is less overlap. The red sphere is labeled “Cepheid.” Right: Two square grayscale images. Top is labeled “HST WFC3-IR.” Bottom labeled “JWST NIRCAM.” Pixels in the top image are noticeably larger than those in the bottom image. Black spots in the bottom image are smaller, more distinct, and more numerous. Click View Description for more details.
This diagram illustrates the combined power of the NASA’s Hubble and Webb space telescopes in nailing down precise distances to a special class of variable star that is used in calibrating the expansion rate of the universe. These Cepheid variable stars are seen in crowded star fields. Light contamination from surrounding stars may make the measurement of the brightness of a Cepheid less precise. Webb’s sharper infrared vision allows for a Cepheid target to be more clearly isolated from surrounding stars, as seen in the right side of the diagram. The Webb data confirms the accuracy of 30 years of Hubble observations of Cepheids that were critical in establishing the bottom rung of the cosmic distance ladder for measuring the universe’s expansion rate. At the left, NGC 5584 is seen in a composite image from Webb’s NIRCam (Near-Infrared Camera) and Hubble’s Wide Field Camera 3.
Download the high-resolution file from the Resource Gallery.
Image Credit: NASA, ESA, A. Riess (STScI), W. Yuan (STScI).

“A particular class of stars, Cepheid variables, has given us the most precise measurements of distance for over a century because these stars are extraordinarily bright: They are supergiant stars, a hundred thousand times the luminosity of the Sun. What’s more, they pulsate (that is, expand and contract in size) over a period of weeks that indicates their relative luminosity. The longer the period, the intrinsically brighter they are. They are the gold standard tool for the purpose of measuring the distances of galaxies a hundred million or more light years away, a crucial step to determine the Hubble constant. Unfortunately, stars in galaxies are crowded together in a small space from our distant vantage point and so we often lack the resolution to separate them from their line-of-sight neighbors.

“A major justification for building the Hubble Space Telescope was to solve this problem. Prior to Hubble’s 1990 launch and its subsequent Cepheid measurements, the expansion rate of the universe was so uncertain astronomers weren’t sure if the universe has been expanding for 10 billion or 20 billion years. That’s because a faster expansion rate will lead to a younger age for the universe, and a slower expansion rate will lead to an older age of the universe. Hubble has better visible-wavelength resolution than any ground-based telescope because it sits above the blurring effects of Earth’s atmosphere. As a result, it can identify individual Cepheid variables in galaxies that are more than a hundred million light-years away and measure the time interval over which they change their brightness.

“However, we also must observe the Cepheids at the near-infrared part of the spectrum to see the light which passes unscathed through intervening dust. (Dust absorbs and scatters blue optical light, making distant objects look faint and fooling us into believing they are farther away than they are). Unfortunately, Hubble’s red-light vision is not as sharp as its blue, so the Cepheid starlight we see there is blended with other stars in its field of view. We can account for the average amount of blending, statistically, the same way a doctor figures out your weight by subtracting the average weight of clothes from the scale reading, but doing so adds noise to the measurements. Some people’s clothes are heavier than others.

“However, sharp infrared vision is one of the James Webb Space Telescope’s superpowers. With its large mirror and sensitive optics, it can readily separate the Cepheid light from neighboring stars with little blending. In the first year of Webb operations with our General Observers program 1685, we collected observations of Cepheids found by Hubble at two steps along what’s known as the cosmic distance ladder. The first step involves observing Cepheids in a galaxy with a known, geometric distance that allows us to calibrate the true luminosity of Cepheids. For our program that galaxy is NGC 4258. The second step is to observe Cepheids in the host galaxies of recent Type Ia supernovae. The combination of the first two steps transfers knowledge of the distance to the supernovae to calibrate their true luminosities. Step three is to observe those supernovae far away where the expansion of the universe is apparent and can be measured by comparing the distances inferred from their brightness and the redshifts of the supernova host galaxies. This sequence of steps is known as the distance ladder.

“We recently got our first Webb measurements from steps one and two which allows us to complete the distance ladder and compare to the previous measurements with Hubble (see figure) Webb’s measurements have dramatically cut the noise in the Cepheid measurements due to the observatory’s resolution at near-infrared wavelengths. This kind of improvement is the stuff astronomers dream of!  We observed more than 320 Cepheids across the first two steps. We confirmed that the earlier Hubble Space Telescope measurements were accurate, albeit noisier.   We have also observed four more supernova hosts with Webb and we see a similar result for the whole sample.

Graphs of the luminosity versus period relationship of cepheids in NGC 5584 (top) and NGC 4258 (bottom), as measured by HST (gray data points) and JWST (red data points). Top graph: The y-axis of luminosity ranges from 27 Vega mag at the bottom to 22 Vega mag at the top, labeled in increments of 0.5. The x-axis of Period is on a log scale ranging from ## days on the right to ## days at the far, labeled at 16, 25, 40, 63, and 100. Bottom graph: y-axis ranges from 26 to 20; x-axis ranges from # to 80, labeled at 5, 10, 20, 40, and 80.
Comparison of Cepheid period-luminosity relations used to measure distances. The red points are from NASA’s Webb, and the gray points are from NASA’s Hubble. The top panel is for NGC 5584, the Type Ia supernova host, with the inset showing image stamps of the same Cepheid seen by each telescope. The bottom panel is for NGC 4258, a galaxy with a known, geometric distance, with the inset showing the difference in distance moduli between NGC 5584 and NGC 4258 as measured with each telescope. The two telescopes are in excellent agreement.
Image Credit: NASA, ESA, A. Riess (STScI), and G. Anand (STScI).

“What the results still do not explain is why the universe appears to be expanding so fast! We can predict the expansion rate of the universe by observing its baby picture, the cosmic microwave background, and then employing our best model of how it grows up over time to tell us how fast the universe should be expanding today. The fact that the present measure of the expansion rate significantly exceeds the prediction is a now decade-long problem called “The Hubble Tension.” The most exciting possibility is that the Tension is a clue about something we are missing in our understanding of the cosmos.

“It may indicate the presence of exotic dark energy, exotic dark matter, a revision to our understanding of gravity, or the presence of a unique particle or field. The more mundane explanation would be multiple measurement errors conspiring in the same direction (astronomers have ruled out a single error by using independent steps), so that is why it is so important to redo the measurements with greater fidelity. With Webb confirming the measurements from Hubble, the Webb measurements provide the strongest evidence yet that systematic errors in Hubble’s Cepheid photometry do not play a significant role in the present Hubble Tension. As a result, the more interesting possibilities remain on the table and the mystery of the Tension deepens.”

Editor’s Note: This post highlights data from a paper that was accepted by The Astrophysical Journal.

Author:

  • Adam Riess is a Bloomberg Distinguished Professor at the Johns Hopkins University, the Thomas J. Barber Professor in Space Studies at the JHU Krieger School of Arts and Sciences, a distinguished astronomer at the Space Telescope Science Institute, and a recipient of the 2011 Nobel Prize in Physics.

Mid-Infrared Instrument Operations Update

 On Apr. 21, 2023, the James Webb Space Telescope team shared that one of the MIRI (Mid-Infrared Instrument) observing modes, called Medium-Resolution Spectroscopy (MRS), showed a reduction in the amount of light registered by MIRI’s detectors. Initial analysis of MIRI’s imaging mode did not show a similar effect. However, as part of the team’s investigation into the issue, additional monitoring observations were taken with MIRI imaging. Combined with earlier data, these new calibrations have revealed a reduced signal for MIRI imaging at the longer wavelengths.

This change does not substantially impact MIRI’s science capabilities but will have an impact on the exposure times needed for MIRI imaging.

There is no risk to the instrument, and the effect on imaging is less than the effect in MRS. The team is investigating the cause of this issue. Regular monitoring observations are being taken to continue measuring the response, and the team is providing updated guidance to Webb’s user community to correct for this change. MIRI’s third observing mode, Low-Resolution Spectroscopy, is currently performing normally, and the investigation of MIRI’s fourth mode, Coronographic Imaging, has not yet concluded.

The Webb team has also enacted a plan for long-term monitoring, and are exploring potential mitigations. The observatory is in good health, and each of Webb’s other scientific instruments are unaffected.

For more information, visit the Space Telescope Science Institute.


Webb Reveals Intricate Details in the Remains of a Dying Star

Editor’s Note: This post highlights data from Webb science in progress, which has not yet been through the peer-review process.

NASA’s James Webb Space Telescope obtained images of the Ring Nebula, one of the best-known examples of a planetary nebula. Much like the Southern Ring Nebula, one of Webb’s first images, the Ring Nebula displays intricate structures of the final stages of a dying star. Roger Wesson from Cardiff University tells us more about this phase of a Sun-like star’s stellar lifecycle and how Webb observations have given him and his colleagues valuable insights into the formation and evolution of these objects, hinting at a key role for binary companions.

This image of the Ring Nebula appears as a distorted doughnut. The nebula’s inner cavity hosts shades of blue and green, while the detailed ring transitions through shades of orange in the inner regions and pink in the outer region. The ring’s inner region has distinct filament elements.
NASA’s James Webb Space Telescope has observed the well-known Ring Nebula in unprecedented detail. Formed by a star throwing off its outer layers as it runs out of fuel, the Ring Nebula is an archetypal planetary nebula. This new image from Webb’s NIRCam (Near-Infrared Camera) shows intricate details of the filament structure of the inner ring. There are some 20,000 dense globules in the nebula, which are rich in molecular hydrogen. In contrast, the inner region shows very hot gas. The main shell contains a thin ring of enhanced emission from carbon-based molecules known as polycyclic aromatic hydrocarbons (PAHs). Download the full-resolution version from the Space Telescope Science Institute. Credit: ESA/Webb, NASA, CSA, M. Barlow (University College London), N. Cox (ACRI-ST), R. Wesson (Cardiff University)

“Planetary nebulae were once thought to be simple, round objects with a single dying star at the center. They were named for their fuzzy, planet-like appearance through small telescopes. Only a few thousand years ago, that star was still a red giant that was shedding most of its mass. As a last farewell, the hot core now ionizes, or heats up, this expelled gas, and the nebula responds with colorful emission of light. Modern observations, though, show that most planetary nebulae display breathtaking complexity. It begs the question: how does a spherical star create such intricate and delicate non-spherical structures?

“The Ring Nebula is an ideal target to unravel some of the mysteries of planetary nebulae. It is nearby, approximately 2,200 light-years away, and bright – visible with binoculars on a clear summer evening from the northern hemisphere and much of the southern. Our team, named the ESSENcE (Evolved StarS and their Nebulae in the JWST Era) team, is an international group of experts on planetary nebulae and related objects. We realized that Webb observations would provide us with invaluable insights, since the Ring Nebula fits nicely in the field of view of Webb’s NIRCam (Near-Infrared Camera) and MIRI (Mid-Infrared Instrument) instruments, allowing us to study it in unprecedented spatial detail. Our proposal to observe it was accepted (General Observers program 1558), and Webb captured images of the Ring Nebula just a few weeks after science operations started on July 12, 2022.

“When we first saw the images, we were stunned by the amount of detail in them. The bright ring that gives the nebula its name is composed of about 20,000 individual clumps of dense molecular hydrogen gas, each of them about as massive as the Earth. Within the ring, there is a narrow band of emission from polycyclic aromatic hydrocarbons, or PAHs – complex carbon-bearing molecules that we would not expect to form in the Ring Nebula. Outside the bright ring, we see curious “spikes” pointing directly away from the central star, which are prominent in the infrared but were only very faintly visible in Hubble Space Telescope images. We think these could be due to molecules that can form in the shadows of the densest parts of the ring, where they are shielded from the direct, intense radiation from the hot central star.

 This image of the Ring Nebula appears as a distorted doughnut. The nebula’s inner cavity hosts shades of red and orange, while the detailed ring transitions through shades of yellow in the inner regions and blue/purple in the outer region. The ring’s inner region has distinct filament elements.
This new image of the Ring Nebula from Webb’s MIRI (Mid-InfraRed Instrument) reveals particular details in the concentric features in the outer regions of the nebulae’s ring. Roughly ten concentric arcs located just beyond the outer edge of the main ring. The arcs are thought to originate from the interaction of the central star with a low-mass companion orbiting at a distance comparable to that between the Earth and Pluto. Download the full-resolution version from the Space Telescope Science Institute. Credit: ESA/Webb, NASA, CSA, M. Barlow (University College London), N. Cox (ACRI-ST), R. Wesson (Cardiff University)

“Our MIRI images provided us with the sharpest and clearest view yet of the faint molecular halo outside the bright ring. A surprising revelation was the presence of up to ten regularly-spaced, concentric features within this faint halo. These arcs must have formed about every 280 years as the central star was shedding its outer layers. When a single star evolves into a planetary nebula, there is no process that we know of that has that kind of time period. Instead, these rings suggest that there must be a companion star in the system, orbiting about as far away from the central star as Pluto does from our Sun. As the dying star was throwing off its atmosphere, the companion star shaped the outflow and sculpted it. No previous telescope had the sensitivity and the spatial resolution to uncover this subtle effect.

“So how did a spherical star form such a structured and complicated nebulae as the Ring Nebula? A little help from a binary companion may well be part of the answer.”

Related Links:

Authors:

  • Roger Wesson is a research associate in the School of Physics and Astronomy at Cardiff University, UK and a co-investigator on the ESSENcE program.
  • Mikako Matsuura is a reader (equivalent to associate professor) in the School of Physics and Astronomy at Cardiff University, UK and a co-investigator on the ESSENcE program.
  • Albert A. Zijlstra is a professor of astrophysics at the University of Manchester, UK and a co-investigator on the ESSENcE program.

Talking with Webb using the Deep Space Network

NASA’s James Webb Space Telescope is nearly 1 million miles (1.5 million kilometer) away from Earth, orbiting around the Sun-Earth Lagrange point 2. How do we send commands and receive telemetry – the science and engineering data from the observatory – from that far away? We use the DSN (Deep Space Network) to communicate with the observatory. We receive data when we have a contact with Webb using a DSN antenna

Sandy Kwan, the mission interface manager for Webb within the DSN, notes that each mesmerizing Webb image that has graced our screens would not have been possible without the support of the DSN antennas and personnel, the backbone of interplanetary communication.

The DSN has three sites around the world, each positioned 120 degrees apart. There are antennas in Goldstone, California; Canberra, Australia; and Madrid, Spain. This allows us to communicate with Webb at any time of day, as the Earth rotates. The DSN is managed by NASA’s Jet Propulsion Laboratory (JPL) in Southern California. Kari Bosley, the lead Webb mission planner at the Space Telescope Science Institute (STScI), walks us through more of this communication process between Webb and the DSN.

This is the 34 meter antenna at Goldstone, California.  The dish is enormous, taking up the bottom right half of the image. The dish, which is white with lines running through it is turned up to the sky. It has a white base that attaches it to the ground, and a smaller building to its left, partially blocked by shrubs and bush.   Behind it are low mountains and a mostly clear sky, with faint layers of clouds off in the distance behind the mountains.
34-meter antenna at Goldstone, CA. Image credit: Kari Bosley
This is the 70 meter antenna at Goldstone, California.  The dish is enormous, taking up most of the image. The dish, which is white with lines running through it is turned up to the sky. It has a white base that attaches it to the ground.  Four people stand to the left giving a sense of scale.  Behind it are low mountains and a mostly cloudy sky.
70-meter antenna at Goldstone, CA. Image credit: Kari Bosley

“How do we plan contact time with Webb? It’s not as simple as picking up the phone and calling the telescope. In order for Earth to connect with Webb there are a few things that happen prior to scheduling a contact. On average, the Webb mission operations center connects with the observatory at least 2-3 times in a 24-hour period. There are mission planners at STScI where the Mission Operations Center (MOC) is located, mission schedulers at JPL, and of course at the DSN complexes. The mission planners at STScI work together with the mission schedulers at JPL to create contacts with Webb.

“How do we know when we can contact Webb? The Flight Dynamics Facility at NASA’s Goddard Space Flight Center sends the MOC at STScI the view periods in which the observatory is visible from those three different DSN sites. The mission scheduler compares those times to what is available in the scheduling system where other missions are competing for time with their spacecraft. All missions require specific amounts of time to communicate with their spacecraft, and the timing depends on where the spacecraft are in space. There are times when conflicts between multiple missions request the same resource at the same time. When this happens, our mission scheduler at JPL will negotiate with other missions to come to a compromise that satisfies all of the missions. Once all negotiations are complete, schedules are sent to the mission planners up to 6 months in advance. The scheduling for the first 8 weeks is fixed, with no changes allowed unless there is an emergency or important event with a spacecraft. The later periods are subject to continuing negotiations.

“Each of the DSN complexes has different types of antennas, including 70-meter (230-foot in diameter), 34-meter (111-foot in diameter), and 26-meter (85-foot in diameter) antennas. The DSN complexes use the 34-meter antennas to talk with Webb with the 70-meter antennas as a backup. The DSN supports different radio frequency allocations, such as the S-band and Ka-band frequencies that Webb uses. S-band has a lower bandwidth, and we use that to send commands to the spacecraft (e.g., start recorder playback), to receive engineering telemetry to monitor the health and safety of the observatory, and for ranging. Ranging is the process of determining Webb’s position and trajectory by the delay between when the signal is sent up and when it is received back on the ground.

“We use Ka-band to downlink stored science and engineering data, and some telemetry from the spacecraft. If we used S-band to downlink data, it would take many days to download each day’s data. With Ka-band, it takes much less time, and we can usually complete download all of the stored data in a couple of hours. The high gain antenna on Webb is used for Ka-band downlink and the medium gain antenna is used for S-band uplink and downlink when both antennas are pointed directly at the complex for a contact. Most of our contacts are 2-6 hours in length. Normally, we request at least 4-hour contacts. Since DSN hosts almost 40 different missions, scheduling is complicated.

“Infographic about communication between the James Webb Space Telescope and the Deep Space Network. Drawing of the telescope is centered at top, with a large ground-based radio antenna centered underneath it, labeled Deep Space Network (DSN). Three dotted-line arrows indicate communication between the telescope and DSN. One green arrow going up to the telescope, one green arrow going back down to the DSN, and a thicker blue arrow going down to the DSN. Green text at left reads, S-band uplink: 16 kbps, Commanding. S-band downlink: 40 kbps, Ranging. Blue text on the right, corresponding with the thicker blue arrow, reads Ka-band downlink: 28 Mbps, stored science and engineering data, telemetry.
Webb talks to the Deep Space Network of antennas using S-band and Ka-band radio frequencies. For S-band communication, commanding instructions are uplinked at 16 kilobits per second (kbps) and observatory engineering telemetry and ranging are downlinked at 40 kbps. For Ka-band communication, stored science and engineering data and telemetry is downlinked at 28 Megabits per second. Image Credit: STScI

“There are times when our contacts are very short and times when they are longer. In each contact, it is important to downlink as much data as we can since the telescope continually makes science observations and acquires more data. When we are not in contact, the telescope continues to autonomously perform science observations. These data are stored on a solid-state recorder and downlinked on our next contact. After the Webb MOC at STScI receives the data and ingests them into the Barbara A. Mikulski Archive for Space Telescope for processing and calibration, the observers will receive the data from their observations.

Phillip Johnson is an operations controller and command controller in the Webb Mission Operations Center (MOC) at the Space Telescope Science Institute (STScI). He works to ensure the health and safety of the observatory, and work in close concert with the ground systems engineers who keep the MOC in contact with the DSN. Image credit: STScI

“Those interested in seeing the downlink and uplink between NASA missions and the DSN can visit the ‘Deep Space Network Now’ website at https://eyes.nasa.gov/dsn/dsn.html. You can view the missions and resources that are actively being used at DSN.”


About the author:

Kari Bosley is the lead mission planner in the Ground Systems Engineering Branch at the Space Telescope Science Institute. She schedules the activities that are executed onboard the James Webb Space Telescope. She also collaborates with other mission planners and schedulers to obtain contact time for Webb through Deep Space Network. Kari thanks Carl Hansen (Webb spacecraft systems engineer at STScI) for providing information on the subject of ranging and data rates.