Category:Fischer projection
Jump to navigation
Jump to search
projection formula in which vertically drawn bonds are considered to lie below the projection plane and horizontal bonds to lie above that plane | |||||
| Upload media | |||||
| Instance of |
| ||||
|---|---|---|---|---|---|
| Named after | |||||
| |||||
The Fischer projection is a two-dimensional representation of a three-dimensional organic molecule by projection.
Subcategories
This category has only the following subcategory.
Media in category "Fischer projection"
The following 169 files are in this category, out of 169 total.
-
052A.png 65 × 130; 380 bytes
-
052B.png 81 × 132; 360 bytes
-
052E.png 66 × 132; 329 bytes
-
053A.png 104 × 142; 399 bytes
-
1-Brom-2-methyl-butan-3-ol.svg 478 × 851; 43 KB
-
4 - O-metil-D-xilitol.png 59 × 94; 334 bytes
-
Aldose.png 332 × 615; 7 KB
-
Aldoses.png 2,872 × 2,091; 75 KB
-
Arabinose-1.png 480 × 386; 6 KB
-
Chlorethan Fischer.svg 113 × 184; 7 KB
-
Cis-2,3-dibromo-2,3-dimetilbutano.jpg 417 × 523; 13 KB
-
D Gliceraldheid.jpg 200 × 270; 9 KB
-
D-Altrose-Aldehyd-Pyranose-Furanose.png 498 × 326; 7 KB
-
D-Erythrose-4-phosphat.svg 114 × 201; 15 KB
-
D-Fructose vs. D-Glucose Structural Formulae V.1.svg 490 × 391; 54 KB
-
D-galactose Fischer.png 106 × 243; 2 KB
-
D-galactose.png 377 × 735; 9 KB
-
D-Galacturonsäure Fischer.svg 129 × 256; 22 KB
-
D-glucose chain (Fischer).svg 184 × 316; 21 KB
-
D-glucose color coded.png 1,185 × 2,040; 30 KB
-
D-Glucose vs. D-Fructose Structural Formulae V.1.svg 495 × 391; 53 KB
-
D-glucose-chain-2D-Fischer.png 589 × 1,011; 11 KB
-
D-glucose.png 377 × 735; 9 KB
-
D-Glyceraldehyde 2D Fischer.svg 74 × 83; 2 KB
-
D-glyceraldehyde Fischer b.png 1,268 × 1,324; 20 KB
-
D-glyceraldehyde-2D-Fischer.png 1,100 × 1,130; 42 KB
-
D-Glycerinaldehyd.png 500 × 492; 12 KB
-
D-Glycerinaldehyd.svg 115 × 121; 9 KB
-
D-Gulose-Aldehyd-Pyranose-Furanose.png 499 × 288; 6 KB
-
D-mannose.png 377 × 735; 9 KB
-
D-Ribose-5-phosphat.svg 115 × 240; 18 KB
-
D-ribose.svg 126 × 252; 14 KB
-
D-ribozo.gif 135 × 337; 1 KB
-
D-Sedoheptulose-7-phosphat.svg 133 × 300; 23 KB
-
D-Talose-Aldehyd-Pyranose-Furanose.png 500 × 308; 7 KB
-
D-threose Fischer.png 106 × 160; 1 KB
-
D-Xylose Fischer.png 191 × 274; 4 KB
-
DAllose Fischer.svg 72 × 140; 12 KB
-
DAltrose Fischer.svg 83 × 140; 13 KB
-
DArabinose Fischer.svg 83 × 120; 10 KB
-
DErythrose Fischer.svg 72 × 98; 9 KB
-
DErythrulose Fischer.svg 70 × 94; 8 KB
-
DFructose Fischer.svg 80 × 136; 12 KB
-
DGalactose Fischer.svg 83 × 140; 13 KB
-
DGlucose Fischer.svg 83 × 140; 12 KB
-
DGlyceraldehyde Fischer.svg 73 × 78; 7 KB
-
DGulose Fischer.svg 83 × 140; 13 KB
-
Diacylglycerol Fischer.svg 133 × 114; 62 KB
-
Diastereomers example.png 838 × 486; 12 KB
-
Diastereomers-Glucose Altrose.png 246 × 228; 11 KB
-
DIdose Fischer.svg 83 × 140; 13 KB
-
DL Nomenclature of Sugars.png 1,151 × 742; 21 KB
-
DL-Alloheptulose.svg 620 × 529; 55 KB
-
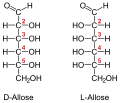
DL-Allose num.svg 343 × 293; 64 KB
-
DL-Allose.svg 343 × 293; 39 KB
-
DL-Altrose num.svg 361 × 293; 67 KB
-
DL-Altrose.svg 361 × 293; 42 KB
-
DL-Arabinose num.svg 361 × 253; 62 KB
-
DL-Arabinose.svg 362 × 253; 42 KB
-
DL-Deoxyribose.png 803 × 557; 12 KB
-
DL-Erythrose num.svg 358 × 218; 52 KB
-
DL-Erythrose.svg 359 × 218; 36 KB
-
DL-Fucose num.svg 357 × 293; 59 KB
-
DL-Fucose.svg 357 × 293; 42 KB
-
DL-Galactose num.svg 361 × 293; 76 KB
-
DL-Galactose.svg 362 × 293; 50 KB
-
DL-glucoheptose.svg 620 × 557; 53 KB
-
DL-Glucosa.png 361 × 243; 11 KB
-
DL-Glucose num.svg 361 × 293; 69 KB
-
DL-Glucose.svg 361 × 293; 28 KB
-
DL-Glycerinaldehyd num.svg 355 × 204; 51 KB
-
DL-Glycerinaldehyd.svg 356 × 204; 41 KB
-
DL-Gulose num.svg 361 × 293; 67 KB
-
DL-Gulose.svg 361 × 293; 42 KB
-
DL-Idose num.svg 361 × 293; 65 KB
-
DL-Idose.svg 361 × 293; 40 KB
-
DL-Lyxose num.svg 361 × 258; 56 KB
-
DL-Lyxose.svg 361 × 258; 36 KB
-
DL-mannoheptose.svg 620 × 543; 54 KB
-
DL-Mannoheptulose.svg 620 × 488; 58 KB
-
DL-Mannose num.svg 361 × 293; 70 KB
-
DL-Mannose.svg 361 × 293; 45 KB
-
DL-Rhamnose num.svg 366 × 293; 64 KB
-
DL-Rhamnose.svg 365 × 293; 48 KB
-
DL-Ribose num.svg 344 × 253; 57 KB
-
DL-Ribose.PNG 813 × 716; 24 KB
-
DL-Ribose.svg 345 × 253; 38 KB
-
DL-Sedoheptulose.svg 620 × 510; 56 KB
-
DL-Taloheptulose.svg 620 × 521; 56 KB
-
DL-Talose num.svg 361 × 293; 67 KB
-
DL-Talose.svg 361 × 293; 42 KB
-
DL-Threose num.svg 361 × 213; 50 KB
-
DL-Threose.svg 361 × 213; 34 KB
-
DL-Xylose num.svg 361 × 258; 56 KB
-
DL-Xylose.PNG 862 × 716; 25 KB
-
DL-Xylose.svg 361 × 258; 36 KB
-
DLyxose Fischer.svg 83 × 120; 10 KB
-
DPsicose Fischer.svg 70 × 136; 12 KB
-
DRibose Fischer.svg 72 × 120; 10 KB
-
DRibulose Fischer.svg 70 × 115; 10 KB
-
DSorbose Fischer.svg 80 × 136; 12 KB
-
DTagatose Fischer.svg 80 × 136; 12 KB
-
DTalose Fischer.svg 83 × 140; 13 KB
-
DThreose Fischer.svg 83 × 98; 8 KB
-
DXylose Fischer.svg 83 × 120; 10 KB
-
DXylulose Fischer.svg 80 × 115; 10 KB
-
Enantiomero.JPG 278 × 188; 10 KB
-
Enantiomers-Glucose.png 223 × 219; 10 KB
-
Epimers-Glucose Mannose.png 255 × 223; 11 KB
-
Erythrose semi dev.png 329 × 523; 5 KB
-
Erythrose semi dev.svg 329 × 523; 1 KB
-
ErythroseThreose.svg 921 × 319; 24 KB
-
Fischer D-glukosa cislovani.PNG 605 × 150; 3 KB
-
Fischer projection conversion.png 968 × 493; 14 KB
-
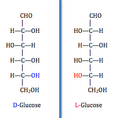
Fischer projection of D- and L-Glucose.svg 394 × 311; 21 KB
-
Fischer projection of D-aldoses1.png 744 × 692; 17 KB
-
Fischer Projection of L-Ribose.jpg 121 × 230; 11 KB
-
Fischer projection.png 236 × 210; 2 KB
-
Fischer Projection2.png 312 × 210; 3 KB
-
Fischer Projection2.svg 744 × 570; 3 KB
-
Fischer to 3D conversion.png 905 × 172; 5 KB
-
Fischer to Haworth.png 1,885 × 437; 39 KB
-
Fischer1.JPG 640 × 512; 9 KB
-
Fischer10.JPG 640 × 512; 14 KB
-
Fischer3.JPG 640 × 512; 13 KB
-
Fischer4.JPG 640 × 512; 22 KB
-
Fischer5.JPG 640 × 512; 23 KB
-
Fischer6.JPG 640 × 512; 20 KB
-
Fischer7.JPG 640 × 512; 15 KB
-
Fischer9.JPG 640 × 512; 15 KB
-
Fisher Projection3.png 763 × 742; 25 KB
-
Fisherproyecciondehexosa.png 683 × 720; 298 KB
-
FP example.svg 626 × 133; 21 KB
-
Fructose Keilstrich-Fischer.svg 613 × 281; 40 KB
-
Fucose.png 1,115 × 1,948; 7 KB
-
Glicose 2.png 150 × 300; 36 KB
-
Glicose 3.png 150 × 300; 37 KB
-
Glucose 1 phosphat.svg 248 × 301; 26 KB
-
Glucose 6 phosphat.svg 248 × 301; 25 KB
-
Glucose Fischerprojektionen.png 449 × 335; 17 KB
-
Glucose mannose epimerization.png 935 × 434; 19 KB
-
GlucoseTeX.PNG 116 × 311; 2 KB
-
Glycerophosphate (S) Fischer.svg 133 × 114; 19 KB
-
Glycerophosphate beta Fischer.svg 133 × 114; 72 KB
-
Glycerophosphate Fischer.svg 133 × 114; 62 KB
-
Haworth to Fischer.png 1,470 × 405; 33 KB
-
Haworth to Fischer.svg 1,470 × 405; 6 KB
-
Isoleucin Diastereomere.svg 638 × 390; 76 KB
-
Isomeric forms of fructose.svg 512 × 248; 61 KB
-
L-arabinose Fischer.png 106 × 202; 2 KB
-
L-glucose.png 377 × 735; 9 KB
-
L-Glyceraldehyde 2D Fischer.svg 85 × 83; 2 KB
-
L-glyceraldehyde-2D-Fischer.png 1,100 × 987; 36 KB
-
L-Glycerinaldehyd.png 500 × 493; 12 KB
-
L-ribose.svg 142 × 252; 14 KB
-
L-Xylose Fischer.png 191 × 274; 4 KB
-
Mannose.svg 83 × 140; 13 KB
-
Monosaccharide stereoisomers.svg 504 × 232; 19 KB
-
Phosphatidic acid Fischer.svg 133 × 114; 62 KB
-
Proiezione di Fischer convenzione.PNG 439 × 107; 3 KB
-
Riduzione-glucosio-(proiez Fischer).png 671 × 366; 7 KB
-
Stereochemistry Henry-reaktion1.svg 759 × 364; 73 KB
-
Stereochemistry Henry-reaktion2.svg 1,103 × 579; 205 KB
-
Strukt vzorec D-threosa.PNG 75 × 88; 807 bytes
-
Strukt vzorec L-threosa.PNG 75 × 88; 795 bytes
-
Synthesis of sorbitol.svg 620 × 315; 45 KB
-
Tartaric acids.png 956 × 822; 16 KB
-
Threitsynthese.png 500 × 179; 13 KB
-
Treoza 007.svg 304 × 189; 46 KB


