Category:Systems biology
Jump to navigation
Jump to search
- (en) Category=Systems biology
- (ar) علم أحياء الأنظمة
- (ca) Biologia de sistemes
- (de) Systembiologie
- (es) Biología de sistemas
- (et) Süsteemibioloogia
- (fa) زیستشناسی سیستمها
- (fr) Biologie des systèmes
- (he) ביולוגיה מערכתית
- (it) Biologia dei sistemi
- (ja) システム
生物 学 - (ko) 계생명학
- (mk) Системска биологија
- (nl) Systeembiologie
- (pl) Biologia systemowa
- (pt) Biologia sistêmica
- (sv) Systembiologi
- (th) ชีววิทยาระบบ
- (vi) Sinh học hệ thống
- (zh)
系 统生物 学
computational and mathematical modeling of complex biological systems | |||||
| Upload media | |||||
| Pronunciation audio | |||||
|---|---|---|---|---|---|
| Instance of | |||||
| Subclass of | |||||
| Different from | |||||
| |||||
Systems biology is a biology-based inter-disciplinary study field that focuses on the systematic study of complex interactions in biological systems, thus using a new holistic perspective to study them.
Subcategories
This category has the following 17 subcategories, out of 17 total.
Media in category "Systems biology"
The following 186 files are in this category, out of 186 total.
-
01RegulonDB.png 361 × 93; 30 KB
-
11538 2016 214 Fig4 HTML.webp 530 × 472; 64 KB
-
A thaliana metabolic network.png 836 × 882; 62 KB
-
Acción de receptores nucleares I.png 1,497 × 994; 469 KB
-
Acción de receptores nucleares II.png 1,502 × 1,129; 537 KB
-
Acidobacterium.jpg 913 × 721; 504 KB
-
Allometric Law of Body Mass vs Cruising Speed in Constructal Theory.svg 1,350 × 900; 160 KB
-
Avesthagen.jpg 267 × 87; 5 KB
-
Banner-COMBINE logo.png 4,476 × 321; 74 KB
-
Banner-shadowed-COMBINE logo.png 4,506 × 351; 202 KB
-
Beamline at Brookhaven National Laboratory.jpg 646 × 700; 504 KB
-
Beta oxidation and glycolysis.svg 525 × 460; 108 KB
-
Bio network visualization.png 1,280 × 1,001; 171 KB
-
Biological and technological scales compared-en.svg 1,062 × 755; 1.46 MB
-
Biological and technological scales compared-es.svg 1,062 × 755; 1.52 MB
-
Biological and technological scales compared-fr.svg 1,062 × 755; 1.46 MB
-
Biological and technological scales compared-mk.svg 1,062 × 755; 1.59 MB
-
Biological and technological scales compared-ru.svg 1,062 × 755; 1.51 MB
-
Biovir.jpg 1,845 × 1,014; 193 KB
-
CAM Kinase II.jpg 600 × 600; 143 KB
-
CDMB2.png 1,083 × 1,084; 253 KB
-
Cellcycle and growth.png 550 × 210; 20 KB
-
CellML logo.svg 392 × 203; 19 KB
-
COMBINE banner.svg 1,052 × 744; 12 KB
-
COMBINE complete.svg 1,052 × 744; 12 KB
-
COMBINE symbol.svg 1,052 × 744; 8 KB
-
COMBINE word.svg 1,052 × 744; 11 KB
-
Community of Cells.jpg 389 × 600; 177 KB
-
Complete-COMBINE logo.png 1,626 × 380; 54 KB
-
Complete-shadowed-COMBINE logo.png 1,634 × 410; 150 KB
-
Computational biology.png 979 × 351; 14 KB
-
Conformational proofreading in homologous recombination.jpg 1,886 × 3,214; 279 KB
-
DendroscopeScreenCaptures.png 1,040 × 960; 75 KB
-
DG Network in Hybrid Rice.png 402 × 236; 55 KB
-
DNA microarray.jpg 280 × 285; 40 KB
-
Double objective EVR.png 1,272 × 789; 36 KB
-
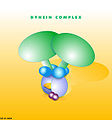
Dynein coplex.jpg 600 × 644; 114 KB
-
E coli metabolic network.png 277 × 417; 69 KB
-
E.coli operon regulation network.jpg 834 × 694; 121 KB
-
EmergyRatios5.png 2,330 × 1,480; 28 KB
-
Equação Diferencial Estocástica.jpg 2,036 × 1,110; 181 KB
-
Example-SBGN-AF.png 412 × 48; 8 KB
-
Example-SBGN-ER.png 327 × 202; 13 KB
-
Example-SBGN-PD.png 753 × 169; 26 KB
-
Feedbackims.jpg 550 × 238; 45 KB
-
Ferrell.jpg 661 × 389; 628 KB
-
Fire board-01.tif 3,300 × 2,550; 32.72 MB
-
FoodWebSimple-es.svg 779 × 640; 28 KB
-
FoodWebSimple.svg 730 × 600; 24 KB
-
FunctionalResponsesGraph.jpg 625 × 477; 47 KB
-
FunctionalResponsesGraph.svg 625 × 477; 8 KB
-
FVA1TomForth.png 754 × 1,000; 140 KB
-
FVA2TomForth.png 753 × 1,000; 131 KB
-
Gene Regulatory Network 2.jpg 1,314 × 686; 336 KB
-
Gene Regulatory Network.jpg 453 × 266; 78 KB
-
Gene to Flux Pipeline.svg 596 × 92; 5 KB
-
Genomics GTL Pictorial Program.jpg 1,000 × 657; 577 KB
-
Genomics GTL Program Payoffs zh.jpg 750 × 563; 148 KB
-
Genomics GTL Program Payoffs.jpg 750 × 563; 501 KB
-
HierarchicalChunking.jpg 696 × 307; 61 KB
-
Highlight Findings of the WA S0E 2007 report.gif 960 × 720; 81 KB
-
Iarc.jpg 1,346 × 811; 304 KB
-
IFTsimplificado.JPG 710 × 511; 41 KB
-
IFTsimplified.JPG 710 × 511; 42 KB
-
JevonsParadoxA.png 652 × 362; 12 KB
-
JevonsParadoxB.png 652 × 362; 13 KB
-
KiSAO logo.svg 518 × 519; 110 KB
-
Lethal Gene Deletion.png 726 × 674; 64 KB
-
LogoWhiteBackBlackLetters-75.png 75 × 36; 3 KB
-
Ls-07 (9614847930).jpg 500 × 375; 181 KB
-
Ls-08 (9614848526).jpg 500 × 375; 142 KB
-
Ls-1 (9611612115).jpg 500 × 375; 116 KB
-
Ls-2 (9614848366).jpg 500 × 375; 144 KB
-
Ls-3 (9611611937).jpg 500 × 375; 89 KB
-
Ls-4 (9611611833).jpg 500 × 375; 146 KB
-
Ls-5 (9611611759).jpg 500 × 375; 70 KB
-
Ls-6 (9611611673).jpg 500 × 375; 154 KB
-
MAPKpathway diagram.svg 295 × 920; 33 KB
-
MAPKpathway.png 294 × 920; 26 KB
-
Mass Spectrometer.jpg 300 × 411; 157 KB
-
Metabolic Network Model for Escherichia coli.jpg 400 × 500; 155 KB
-
MFASystem 1.png 728 × 499; 31 KB
-
MFASystem 2.png 711 × 368; 30 KB
-
MFASystem 3.png 1,620 × 800; 33 KB
-
Miase 170.png 170 × 114; 57 KB
-
MIRIAM logo.png 747 × 499; 340 KB
-
Modeling the dynamics of life 005.jpg 1,180 × 590; 139 KB
-
Molecular Machines of Life.jpg 400 × 500; 152 KB
-
Morgansystem.jpg 733 × 449; 647 KB
-
Nahrungspyramide Schema.png 1,390 × 1,040; 90 KB
-
Negative Feedback Loop with three reaction steps.pdf 708 × 187; 54 KB
-
NegFeedback FourSteps SNames.png 3,000 × 518; 57 KB
-
NERSC Accomplishments.jpg 600 × 748; 305 KB
-
Non lethal Gene Deletion.png 726 × 674; 73 KB
-
Nuclear receptor action.png 2,990 × 1,794; 1,010 KB
-
Pathway Kinetics.gif 379 × 336; 13 KB
-
Pathway to genome.png 7,390 × 4,500; 3.27 MB
-
Pathway to genome.svg 1,600 × 780; 4.98 MB
-
PH-Regulation in Aspergillus.svg 900 × 700; 91 KB
-
Popsize versus TMRCA and gentimes.PNG 666 × 454; 19 KB
-
Poster for Nerve Circle's Weird Thing Zone, Williamsburg, Brooklyn 1991.tif 3,030 × 4,020; 69.74 MB
-
Prepare for FBA maths.png 1,503 × 1,274; 194 KB
-
Prepare for FBA.png 1,503 × 674; 43 KB
-
Product portfolio EVR.png 1,465 × 836; 34 KB
-
Proteasome.jpg 474 × 509; 130 KB
-
Protein Complex.jpg 327 × 308; 73 KB
-
Protein Machine.jpg 612 × 575; 179 KB
-
Protein Machines.jpg 800 × 1,000; 187 KB
-
Quantitative parasitology 1.JPG 598 × 434; 26 KB
-
Quantitative Parasitology 30 windows.jpg 1,116 × 670; 88 KB
-
Quantitative Parasitology on theWeb 10.jpg 921 × 611; 90 KB
-
RAD Complex.jpg 500 × 500; 211 KB
-
Recon 2.1 fig1.svg 562 × 202; 21 KB
-
Recon 2.1 fig2.svg 562 × 131; 19 KB
-
RegulonDBhead.gif 1,046 × 122; 9 KB
-
RegulonDBSearchOptions.gif 233 × 117; 3 KB
-
Resilience1.jpg 2,221 × 1,004; 215 KB
-
Results of FBA maths.png 1,666 × 946; 162 KB
-
Results of FBA.png 1,666 × 693; 147 KB
-
Robert U. Ayres 2003.jpg 102 × 147; 3 KB
-
SBGN-logo-WhiteBackground-1024.png 1,024 × 492; 87 KB
-
SBGN-logo-WhiteBackground-150.png 150 × 72; 7 KB
-
SBO logo.png 749 × 499; 318 KB
-
SEDML logo.png 567 × 313; 18 KB
-
Signal transduction pathways (zh-cn).svg 1,858 × 1,364; 146 KB
-
Signal transduction pathways zh.png 1,858 × 1,364; 754 KB
-
Signal transduction pathways.png 1,858 × 1,364; 709 KB
-
Signal transduction v1.png 1,858 × 1,364; 253 KB
-
Simple Branch Pathway.png 431 × 416; 7 KB
-
Simple Branched Metabolic Pathway.pdf 222 × 166; 47 KB
-
Simple Branched Metabolic Pathway.png 1,600 × 1,206; 63 KB
-
SimpleReaction.png 1,328 × 871; 48 KB
-
Single and double chromosomes.png 162 × 183; 4 KB
-
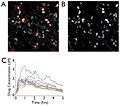
Single-Cell-Analysis-of-Drug-Distribution-by-Intravital-Imaging-pone.0060988.s001.tiff 2,049 × 1,316; 1.17 MB
-
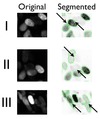
Single-Cell-Analysis-of-Drug-Distribution-by-Intravital-Imaging-pone.0060988.s002.tiff 1,458 × 1,740; 1,023 KB
-
Single-Cell-Analysis-of-Drug-Distribution-by-Intravital-Imaging-pone.0060988.s003.tiff 2,049 × 1,499; 1.27 MB
-
Sistema del doble híbrido (Two-hybrid screening).JPG 835 × 490; 58 KB
-
Skotheimsystem.jpg 573 × 572; 648 KB
-
Statetable1.png 186 × 343; 4 KB
-
Statetable2.png 186 × 342; 6 KB
-
Streptomyces coelicolor sc.gif 250 × 250; 16 KB
-
Summary of interactions between CD8+ T cells and Beta cells in Diabetes I.tif 2,248 × 1,245; 459 KB
-
Supercomputers Will Decipher How Genes Work.jpg 1,000 × 750; 587 KB
-
Symbol-COMBINE logo.png 317 × 312; 11 KB
-
Symbol-shadowed-COMBINE logo.png 347 × 342; 30 KB
-
Systembiologie.jpg 773 × 546; 57 KB
-
Systems diagram of a city-es.png 2,484 × 1,671; 222 KB
-
Systems diagram of a city.png 2,484 × 1,671; 52 KB
-
Systems-Biology-Approach-to-Model-the-Life-Cycle-of-Trypanosoma-cruzi-pone.0146947.s004.ogv 3.7 s, 360 × 379; 102 KB
-
Systems-Biology-Approach-to-Model-the-Life-Cycle-of-Trypanosoma-cruzi-pone.0146947.s005.ogv 3.7 s, 360 × 379; 102 KB
-
Systems-Biology-Approach-to-Model-the-Life-Cycle-of-Trypanosoma-cruzi-pone.0146947.s006.ogv 3.7 s, 360 × 379; 87 KB
-
Systems-Biology-Approach-to-Model-the-Life-Cycle-of-Trypanosoma-cruzi-pone.0146947.s007.ogv 3.7 s, 360 × 379; 99 KB
-
Systems-Biology-Approach-to-Model-the-Life-Cycle-of-Trypanosoma-cruzi-pone.0146947.s008.ogv 3.7 s, 360 × 379; 105 KB
-
TEDDY logo.svg 950 × 650; 21 KB
-
TEDDY Ontology logo.png 960 × 640; 198 KB
-
Trasduzione del segnale.png 1,858 × 1,364; 247 KB
-
Type ii nuclear receptor action.png 2,999 × 2,249; 1,015 KB
-
-
-
-
-
-
-
Whole plant mg transport.png 500 × 372; 51 KB
-
Wikiresponsecurves1.jpg 1,832 × 3,460; 686 KB
-
Word-COMBINE logo.png 1,596 × 321; 34 KB
-
Word-shadowed-COMBINE logo.png 1,626 × 351; 92 KB
-
Zyklus Netzwerkinferenz.jpg 1,280 × 720; 76 KB


