
St. Clair County, Illinois: Difference between revisions
Overtone11 (talk | contribs) Ce Tags: Mobile edit Mobile web edit Advanced mobile edit |
Red Director (talk | contribs) |
||
| (15 intermediate revisions by 14 users not shown) | |||
| Line 1: | Line 1: | ||
{{Short description|County in Illinois, United States}} |
{{Short description|County in Illinois, United States}} |
||
{{Use mdy dates|date= |
{{Use mdy dates|date=April 2024}} |
||
{{Infobox U.S. county |
{{Infobox U.S. county |
||
| county = St. Clair County |
| county = St. Clair County |
||
| state = Illinois |
| state = Illinois |
||
| ex image = |
| ex image = County Courthouse, Belleville, IL.jpg |
||
| ex image cap = [[St. Clair County Courthouse (Illinois)|St. Clair County Courthouse]] in Belleville |
| ex image cap = [[St. Clair County Courthouse (Illinois)|St. Clair County Courthouse]] in Belleville |
||
| flag = Flag of St. Clair County, Illinois.svg |
| flag = Flag of St. Clair County, Illinois.svg |
||
| Line 21: | Line 21: | ||
| web = www.co.st-clair.il.us |
| web = www.co.st-clair.il.us |
||
| named for = [[Arthur St. Clair]] |
| named for = [[Arthur St. Clair]] |
||
| |
| district2 = 12th |
||
| district3 = 13th |
|||
}} |
}} |
||
[[Image:Victorian home restored.JPG|thumb|right|House in Lebanon, Il historic district]] |
[[Image:Victorian home restored.JPG|thumb|right|House in Lebanon, Il historic district]] |
||
[[Image:Mermaid House Hotel.JPG|thumb|right|Mermaid House Hotel, Lebanon, Illinois]] |
[[Image:Mermaid House Hotel.JPG|thumb|right|Mermaid House Hotel, Lebanon, Illinois]] |
||
'''St. Clair County''' is the |
'''St. Clair County''' is the [[List of counties in Illinois|ninth most populous county]] in [[Illinois]]. Located directly east of [[St. Louis]], the county is part of the [[Metro East]] region of the [[Greater St. Louis]] metropolitan area in [[southern Illinois]]. As of the [[2020 United States census]], St. Clair County had a population of 257,400, making it the third most populous county in Illinois outside the [[Chicago metropolitan area]]. [[Belleville, Illinois|Belleville]] is the county’s [[County seat|seat]] and largest city.<ref>{{cite web|url=http://www.naco.org/Counties/Pages/FindACounty.aspx|access-date=June 7, 2011|title=Find a County|publisher=National Association of Counties}}</ref> |
||
[[Cahokia, Illinois|Cahokia Village]] was founded in 1697 by French settlers and served as a Jesuit mission to convert tribes of the [[Illinois Confederation]] to Christianity. Prior to the establishment of Illinois as a state, the government of the [[Northwest Territory]] created St. Clair County in 1790 out of the western half of Knox County. In 1809, the county became the administrative center of the [[Illinois Territory]] and one of the two original counties of Illinois, alongside [[Randolph County, Illinois|Randolph County]]. |
|||
St. Clair County is part of the [[American Bottom]] or [[Metro-East]] area of the [[St. Louis]], [[Missouri|MO]]-IL [[Greater St. Louis|Metropolitan Statistical Area]]. |
|||
In 1970, the [[United States Census Bureau]] placed the [[mean center of U.S. population]] in St. Clair County.<ref>{{cite web|url=https://www.census.gov/geo/www/cenpop/meanctr.pdf|title=Mean Center of Population for the United States: 1790 to 2000|access-date= |
In 1970, the [[United States Census Bureau]] placed the [[mean center of U.S. population]] in St. Clair County.<ref>{{cite web|url=https://www.census.gov/geo/www/cenpop/meanctr.pdf|title=Mean Center of Population for the United States: 1790 to 2000|access-date=September 17, 2011|publisher=US Census Bureau|url-status=dead|archive-url=https://web.archive.org/web/20011103033717/http://www.census.gov/geo/www/cenpop/meanctr.pdf|archive-date=November 3, 2001}}</ref> |
||
==History== |
==History== |
||
| Line 37: | Line 38: | ||
After the United States [[American Revolutionary War|achieved independence]] in the late 18th century, St. Clair County was the first county established in present-day Illinois; it antedates Illinois' existence as a separate jurisdiction. The county was established in 1790 by a proclamation of [[Arthur St. Clair]], first governor of the [[Northwest Territory]], who named it after himself. |
After the United States [[American Revolutionary War|achieved independence]] in the late 18th century, St. Clair County was the first county established in present-day Illinois; it antedates Illinois' existence as a separate jurisdiction. The county was established in 1790 by a proclamation of [[Arthur St. Clair]], first governor of the [[Northwest Territory]], who named it after himself. |
||
The original boundary of St. Clair county covered a large area between the [[Mackinaw River|Mackinaw]] and [[Ohio River|Ohio]] rivers. In 1801, Governor [[William Henry Harrison]] re-established St. Clair County as part of the [[Indiana Territory]], extending its northern border to [[Lake Superior]] and the international border with [[Rupert's Land]].<ref name=white>White, Jesse. ''Origin and Evolution of Illinois Counties.'' State of Illinois, March 2010. [http://www.cyberdriveillinois.com/publications/pdf_publications/ipub15.pdf]</ref> |
The original boundary of St. Clair county covered a large area between the [[Mackinaw River|Mackinaw]] and [[Ohio River|Ohio]] rivers. In 1801, Governor [[William Henry Harrison]] re-established St. Clair County as part of the [[Indiana Territory]], extending its northern border to [[Lake Superior]] and the international border with [[Rupert's Land]].<ref name="white">White, Jesse. ''Origin and Evolution of Illinois Counties.'' State of Illinois, March 2010. [http://www.cyberdriveillinois.com/publications/pdf_publications/ipub15.pdf]</ref> |
||
When the [[Illinois Territory]] was created in 1809, Territorial Secretary [[Nathaniel Pope]], in his capacity as acting governor, issued a proclamation establishing St. Clair and [[Randolph County, Illinois|Randolph County]] as the two original counties of Illinois. |
When the [[Illinois Territory]] was created in 1809, Territorial Secretary [[Nathaniel Pope]], in his capacity as acting governor, issued a proclamation establishing St. Clair and [[Randolph County, Illinois|Randolph County]] as the two original counties of Illinois. |
||
| Line 47: | Line 48: | ||
File:St. Clair County Illinois 1816.png|St. Clair County between 1816 and 1818 |
File:St. Clair County Illinois 1816.png|St. Clair County between 1816 and 1818 |
||
File:St. Clair County Illinois 1818.png|St. Clair County between 1818 and 1825 |
File:St. Clair County Illinois 1818.png|St. Clair County between 1818 and 1825 |
||
File:St. Clair County |
File:St. Clair County Illinois 1825.png|St. Clair County between 1825 and 1827 |
||
File:St. Clair County Illinois 1827.png|St. Clair County from 1827 to present |
File:St. Clair County Illinois 1827.png|St. Clair County from 1827 to present |
||
</gallery> |
</gallery> |
||
| Line 60: | Line 61: | ||
In February 1917 tensions in the city arose as white workers struck at the [[Aluminum Ore Company]]. Employers fiercely resisted union organizing, sometimes with violence. In this case they hired hundreds of blacks as strikebreakers. White workers complained to the city council about this practice in late May. Rumors circulated about an armed African American man robbing a white man, and whites began to attack blacks on the street. The governor ordered in the National Guard and peace seemed restored by early June. |
In February 1917 tensions in the city arose as white workers struck at the [[Aluminum Ore Company]]. Employers fiercely resisted union organizing, sometimes with violence. In this case they hired hundreds of blacks as strikebreakers. White workers complained to the city council about this practice in late May. Rumors circulated about an armed African American man robbing a white man, and whites began to attack blacks on the street. The governor ordered in the National Guard and peace seemed restored by early June. |
||
"On July 1, a white man in a Ford shot into black homes. Armed African-Americans gathered in the area and shot into another oncoming Ford, killing two men who turned out to be police officers investigating the shooting."<ref name="smith"/> Word spread and whites gathered at the Labor Temple; the next day they fanned out across the city, armed with guns, clubs, anything they could use against the blacks they encountered. From July 1 through July 3, 1917, the [[East St. Louis riots]] engulfed the city, with whites attacking blacks throughout the city, pulling them from streetcars, shooting and hanging them, burning their houses. During this period, some African Americans tried to swim or use boats to get to safety; thousands crossed the [[Eads Bridge]] to St. Louis, seeking refuge, until the police closed it off. The official death toll was 39 blacks and nine whites, but some historians believe more blacks were killed.<ref name="smith">[https://www.smithsonianmag.com/smithsonian-institution/east-st-louis-race-riot-left-dozens-dead-devastating-community-on-the-rise-180963885/#kWLjUYlGxGqo7fTY.99 Alison Keyes, "The East St. Louis Race Riot Left Dozens Dead, Devastating a Community on the Rise"], ''Smithsonian Magazine'', |
"On July 1, a white man in a Ford shot into black homes. Armed African-Americans gathered in the area and shot into another oncoming Ford, killing two men who turned out to be police officers investigating the shooting."<ref name="smith"/> Word spread and whites gathered at the Labor Temple; the next day they fanned out across the city, armed with guns, clubs, anything they could use against the blacks they encountered. From July 1 through July 3, 1917, the [[East St. Louis riots]] engulfed the city, with whites attacking blacks throughout the city, pulling them from streetcars, shooting and hanging them, burning their houses. During this period, some African Americans tried to swim or use boats to get to safety; thousands crossed the [[Eads Bridge]] to St. Louis, seeking refuge, until the police closed it off. The official death toll was 39 blacks and nine whites, but some historians believe more blacks were killed.<ref name="smith">[https://www.smithsonianmag.com/smithsonian-institution/east-st-louis-race-riot-left-dozens-dead-devastating-community-on-the-rise-180963885/#kWLjUYlGxGqo7fTY.99 Alison Keyes, "The East St. Louis Race Riot Left Dozens Dead, Devastating a Community on the Rise"], ''Smithsonian Magazine'', June 30, 2017; accessed May 26, 2018</ref> Because the riots were racial terrorism, the Equal Justice Initiative has included these deaths among the lynchings of African Americans in the state of Illinois in its 2017 3rd edition of its report, ''Lynching in America''.<ref>{{Cite web |url=https://eji.org/sites/default/files/lynching-in-america-third-edition-summary.pdf |title=''Lynching in America/Supplement by County'', 3rd ed. (2017) p. 4 |access-date=July 5, 2018 |archive-url=https://web.archive.org/web/20171023063004/https://eji.org/sites/default/files/lynching-in-america-third-edition-summary.pdf |archive-date=October 23, 2017 |url-status=dead }}</ref> |
||
The riots had disrupted East St. Louis, which had seemed to be on the rise as a flourishing industrial city. In addition to the human toll, they cost approximately $400,000 in property damage<ref>{{cite web|url=https://nationalhumanitiescenter.org/pds/maai2/forward/text4/silentprotest.pdf|title=The Negro Silent Protest Parade organized by the NAACP Fifth Ave., New York City July 28, 1917|date=2014|website=National Humanities Center, Research Triangle Park, NC|publisher=National Humanities Center|access-date=July 28, 2017}}</ref> (over $8 million, in 2017 US Dollars <ref>{{cite web|url=http://www.dollartimes.com/inflation/inflation.php?amount=400000&year=1917|title=Calculate the value of $400,000 in 1917|website=www.dollartimes.com}}</ref>). They have been described as among the worst labor and race-related riots in United States history, and they devastated the African-American community. |
The riots had disrupted East St. Louis, which had seemed to be on the rise as a flourishing industrial city. In addition to the human toll, they cost approximately $400,000 in property damage<ref>{{cite web|url=https://nationalhumanitiescenter.org/pds/maai2/forward/text4/silentprotest.pdf|title=The Negro Silent Protest Parade organized by the NAACP Fifth Ave., New York City July 28, 1917|date=2014|website=National Humanities Center, Research Triangle Park, NC|publisher=National Humanities Center|access-date=July 28, 2017}}</ref> (over $8 million, in 2017 US Dollars <ref>{{cite web|url=http://www.dollartimes.com/inflation/inflation.php?amount=400000&year=1917|title=Calculate the value of $400,000 in 1917|website=www.dollartimes.com}}</ref>). They have been described as among the worst labor and race-related riots in United States history, and they devastated the African-American community. |
||
| Line 94: | Line 95: | ||
|clear=both |
|clear=both |
||
|source=The Weather Channel<ref name=WX>{{cite web|url=http://www.weather.com/weather/wxclimatology/monthly/graph/USIL0089|title=Monthly Averages for Belleville IL|access-date=January 27, 2011|publisher=The Weather Channel}}</ref>}} |
|source=The Weather Channel<ref name=WX>{{cite web|url=http://www.weather.com/weather/wxclimatology/monthly/graph/USIL0089|title=Monthly Averages for Belleville IL|access-date=January 27, 2011|publisher=The Weather Channel}}</ref>}} |
||
In recent years, average temperatures in the county seat of Belleville have ranged from a low of {{convert|22|°F}} in January to a high of {{convert|90|°F}} in July, although a record low of {{convert|-27|°F}} was recorded in January 1977 and a record high of {{convert|117|°F|°C}} at [[East St. Louis, Illinois]] was recorded in July 1954.<ref>{{cite journal|last=Westcott|first=Nancy E.|title=The Prolonged 1954 Midwestern US Heat Wave: Impacts and Responses|journal=Wea. Climate Soc.|volume=3|issue=3|pages=165–76|date=July 2011|doi=10.1175/WCAS-D-10-05002.1|doi-access=free}}</ref><ref>{{cite press release|title=Lessons Learned from 1950s' Heat Wave Show Planning Needed for Future Severe Events|publisher=Illinois State Water Survey|date= |
In recent years, average temperatures in the county seat of Belleville have ranged from a low of {{convert|22|°F}} in January to a high of {{convert|90|°F}} in July, although a record low of {{convert|-27|°F}} was recorded in January 1977 and a record high of {{convert|117|°F|°C}} at [[East St. Louis, Illinois]] was recorded in July 1954.<ref>{{cite journal|last=Westcott|first=Nancy E.|title=The Prolonged 1954 Midwestern US Heat Wave: Impacts and Responses|journal=Wea. Climate Soc.|volume=3|issue=3|pages=165–76|date=July 2011|doi=10.1175/WCAS-D-10-05002.1|doi-access=free}}</ref><ref>{{cite press release|title=Lessons Learned from 1950s' Heat Wave Show Planning Needed for Future Severe Events|publisher=Illinois State Water Survey|date=May 18, 2011|url=http://www.isws.illinois.edu/hilites/press/110518heat.asp|access-date=November 4, 2011|archive-url=https://web.archive.org/web/20120415121240/http://www.isws.illinois.edu/hilites/press/110518heat.asp|archive-date=April 15, 2012|url-status=dead}}</ref><ref>{{cite conference|first=Nancy|last=Westcott|title=Impacts of the 1954 Heat Wave|book-title=18th Conference on Applied Climatology|publisher=American Meteorological Society|date=January 19, 2010|location=Atlanta GA|url=http://ams.confex.com/ams/90annual/techprogram/paper_164354.htm}}</ref> Average monthly precipitation ranged from {{convert|2.02|in}} in January to {{convert|4.18|in}} in May.<ref name=WX/> |
||
==Transportation== |
==Transportation== |
||
| Line 121: | Line 122: | ||
===Public transit=== |
===Public transit=== |
||
[[File:Map of the East St. Louis and Suburban Company c 1912.png|thumb|Map of the East St. Louis and Suburban Company c 1912]] |
|||
St. Clair County is home to 11 [[St. Louis MetroLink]] stations on the [[Red Line (St. Louis MetroLink)|Red]] and [[Blue Line (St. Louis MetroLink)|Blue]] Lines. |
St. Clair County is home to 11 [[St. Louis MetroLink]] stations on the [[Red Line (St. Louis MetroLink)|Red]] and [[Blue Line (St. Louis MetroLink)|Blue]] Lines. |
||
{{div col}} |
{{div col}} |
||
| Line 172: | Line 176: | ||
|2010= 270056 |
|2010= 270056 |
||
|2020= 257400 |
|2020= 257400 |
||
|estyear=2023 |
|||
|estimate=251018 |
|||
|estref=<ref name="USCensusEst2023">{{cite web|url=https://www.census.gov/programs-surveys/popest/data/tables.html|title=Annual Estimates of the Resident Population for Counties: April 1, 2020 to July 1, 2023|publisher=United States Census Bureau|access-date=April 2, 2024}}</ref> |
|||
|align-fn=center |
|align-fn=center |
||
|footnote=US Decennial Census<ref>{{cite web|url=https://www.census.gov/programs-surveys/decennial-census.html|title=US Decennial Census|publisher=US Census Bureau|access-date=July 8, 2014}}</ref><br/>1790-1960<ref>{{cite web|url=http://mapserver.lib.virginia.edu|title=Historical Census Browser|publisher=University of Virginia Library|access-date=July 8, 2014}}</ref> 1900-1990<ref>{{cite web|url=https://www.census.gov/population/cencounts/il190090.txt|title=Population of Counties by Decennial Census: 1900 to 1990|publisher=US Census Bureau|access-date=July 8, 2014}}</ref><br/>1990-2000<ref>{{cite web|url=https://www.census.gov/population/www/cen2000/briefs/phc-t4/tables/tab02.pdf|title=Census 2000 PHC-T-4. Ranking Tables for Counties: 1990 and 2000|publisher=US Census Bureau|access-date=July 8, 2014}}</ref> 2010-2019<ref name="QF">{{cite web|title=State & County QuickFacts|url=http://quickfacts.census.gov/qfd/states/17/17163.html|publisher=US Census Bureau|access-date=July 8, 2014|archive-date=June 7, 2011|archive-url=https://web.archive.org/web/20110607104547/http://quickfacts.census.gov/qfd/states/17/17163.html|url-status=dead}}</ref> |
|footnote=US Decennial Census<ref>{{cite web|url=https://www.census.gov/programs-surveys/decennial-census.html|title=US Decennial Census|publisher=US Census Bureau|access-date=July 8, 2014}}</ref><br/>1790-1960<ref>{{cite web|url=http://mapserver.lib.virginia.edu|title=Historical Census Browser|publisher=University of Virginia Library|access-date=July 8, 2014}}</ref> 1900-1990<ref>{{cite web|url=https://www.census.gov/population/cencounts/il190090.txt|title=Population of Counties by Decennial Census: 1900 to 1990|publisher=US Census Bureau|access-date=July 8, 2014}}</ref><br/>1990-2000<ref>{{cite web|url=https://www.census.gov/population/www/cen2000/briefs/phc-t4/tables/tab02.pdf|title=Census 2000 PHC-T-4. Ranking Tables for Counties: 1990 and 2000|publisher=US Census Bureau|access-date=July 8, 2014}}</ref> 2010-2019<ref name="QF">{{cite web|title=State & County QuickFacts|url=http://quickfacts.census.gov/qfd/states/17/17163.html|publisher=US Census Bureau|access-date=July 8, 2014|archive-date=June 7, 2011|archive-url=https://web.archive.org/web/20110607104547/http://quickfacts.census.gov/qfd/states/17/17163.html|url-status=dead}}</ref> |
||
}} |
}} |
||
In the [[2020 United States Census]] the racial makeup of the county was 59.6% White, 29.7% black or African American, 1.4% Asian, 0.3% American Indian, 0.1% Pacific islander, 2.1% from other races, and 6.8% from two or more races. 4.9% were of Hispanic or Latino origin.<ref>{{cite web|url=https://data.census.gov/cedsci/profile?g=0500000US17163|title=St. Clair County, Illinois|access-date= |
In the [[2020 United States Census]] the racial makeup of the county was 59.6% White, 29.7% black or African American, 1.4% Asian, 0.3% American Indian, 0.1% Pacific islander, 2.1% from other races, and 6.8% from two or more races. 4.9% were of Hispanic or Latino origin.<ref>{{cite web|url=https://data.census.gov/cedsci/profile?g=0500000US17163|title=St. Clair County, Illinois|access-date=January 9, 2020|publisher=US Census Bureau}}</ref> |
||
As of the [[2010 United States Census]], there were 270,056 people, 105,045 households, and 70,689 families residing in the county.<ref>{{cite web|url=http://factfinder.census.gov/bkmk/table/1.0/en/DEC/10_DP/DPDP1/0500000US17163|title=Profile of General Population and Housing Characteristics: 2010 Demographic Profile Data|access-date=12 |
As of the [[2010 United States Census]], there were 270,056 people, 105,045 households, and 70,689 families residing in the county.<ref>{{cite web|url=http://factfinder.census.gov/bkmk/table/1.0/en/DEC/10_DP/DPDP1/0500000US17163|title=Profile of General Population and Housing Characteristics: 2010 Demographic Profile Data|access-date=July 12, 2015|publisher=US Census Bureau|archive-url=https://archive.today/20200213022416/http://factfinder.census.gov/bkmk/table/1.0/en/DEC/10_DP/DPDP1/0500000US17163|archive-date=February 13, 2020|url-status=dead}}</ref> The population density was {{convert|410.6|PD/sqmi}}. There were 116,249 housing units at an average density of {{convert|176.7|/sqmi}}.<ref name=CD>{{cite web|url=http://factfinder.census.gov/bkmk/table/1.0/en/DEC/10_SF1/GCTPH1.CY10/0500000US17163|access-date=July 12, 2015|title=Population, Housing Units, Area, and Density: 2010 - County|publisher=US Census Bureau|archive-url=https://archive.today/20200212200813/http://factfinder.census.gov/bkmk/table/1.0/en/DEC/10_SF1/GCTPH1.CY10/0500000US17163|archive-date=February 12, 2020|url-status=dead}}</ref> The racial makeup of the county was 64.6% white, 30.5% black or African American, 1.2% Asian, 0.2% American Indian, 0.1% Pacific islander, 1.2% from other races, and 2.2% from two or more races. Those of Hispanic or Latino origin made up 3.3% of the population. In terms of ancestry, 27.5% were [[Germans|German]], 11.1% were [[Irish people|Irish]], 7.4% were [[English people|English]], and 4.6% were [[Americans|American]].<ref>{{cite web|url=http://factfinder.census.gov/bkmk/table/1.0/en/ACS/10_5YR/DP02/0500000US17163|title=Selected Social Characteristics in the United States – 2006-2010 American Community Survey 5-Year Estimates|access-date=July 12, 2015|publisher=US Census Bureau|archive-url=https://archive.today/20200213032555/http://factfinder.census.gov/bkmk/table/1.0/en/ACS/10_5YR/DP02/0500000US17163|archive-date=February 13, 2020|url-status=dead}}</ref> |
||
Of the 105,045 households, 34.7% had children under the age of 18 living with them, 44.6% were married couples living together, 17.7% had a female householder with no husband present, 32.7% were non-families, and 27.5% of all households were made up of individuals. The average household size was 2.53 and the average family size was 3.09. The median age was 36.9 years. |
Of the 105,045 households, 34.7% had children under the age of 18 living with them, 44.6% were married couples living together, 17.7% had a female householder with no husband present, 32.7% were non-families, and 27.5% of all households were made up of individuals. The average household size was 2.53 and the average family size was 3.09. The median age was 36.9 years. |
||
The median income for a household in the county was $48,562 and the median income for a family was $61,042. Males had a median income of $47,958 versus $34,774 for females. The per capita income for the county was $24,770. About 12.3% of families and 15.5% of the population were below the [[poverty line]], including 24.7% of those under age 18 and 9.7% of those age 65 or over.<ref>{{cite web|url=http://factfinder.census.gov/bkmk/table/1.0/en/ACS/10_5YR/DP03/0500000US17163|title=Selected Economic Characteristics – 2006-2010 American Community Survey 5-Year Estimates|access-date=12 |
The median income for a household in the county was $48,562 and the median income for a family was $61,042. Males had a median income of $47,958 versus $34,774 for females. The per capita income for the county was $24,770. About 12.3% of families and 15.5% of the population were below the [[poverty line]], including 24.7% of those under age 18 and 9.7% of those age 65 or over.<ref>{{cite web|url=http://factfinder.census.gov/bkmk/table/1.0/en/ACS/10_5YR/DP03/0500000US17163|title=Selected Economic Characteristics – 2006-2010 American Community Survey 5-Year Estimates|access-date=July 12, 2015|publisher=US Census Bureau|archive-url=https://archive.today/20200213025854/http://factfinder.census.gov/bkmk/table/1.0/en/ACS/10_5YR/DP03/0500000US17163|archive-date=February 13, 2020|url-status=dead}}</ref> |
||
==Government and infrastructure== |
==Government and infrastructure== |
||
| Line 191: | Line 198: | ||
===Politics=== |
===Politics=== |
||
St. Clair County is a reliably [[Democratic Party (United States)|Democratic]] county, having voted for the Democratic presidential candidate in every presidential election since 1928, with the exception of the [[1972 United States presidential election]]. |
St. Clair County is a reliably [[Democratic Party (United States)|Democratic]] county, having voted for the Democratic presidential candidate in every presidential election since 1928, with the exception of the [[1972 United States presidential election]]. |
||
{{PresHead|place=St. Clair County, Illinois| |
{{PresHead|place=St. Clair County, Illinois|source=<ref>{{cite web|url=http://uselectionatlas.org/RESULTS|title=Atlas of US Presidential Elections|first=David|last=Leip|website=uselectionatlas.org|access-date=March 27, 2018}}</ref>}} |
||
<!-- PresRow should be {{PresRow|Year|Winning party|GOP |
<!-- PresRow should be {{PresRow|Year|Winning party|GOP vote #|Dem vote #|3rd party vote #|State}} --> |
||
{{PresRow|2020|Democratic|57,150|68,325| |
{{PresRow|2020|Democratic|57,150|68,325|3,030|Illinois}} |
||
{{PresRow|2016|Democratic|53,857|60,756|6,823|Illinois}} |
{{PresRow|2016|Democratic|53,857|60,756|6,823|Illinois}} |
||
{{PresRow|2012|Democratic|50,125|67,285|2,417|Illinois}} |
{{PresRow|2012|Democratic|50,125|67,285|2,417|Illinois}} |
||
| Line 312: | Line 319: | ||
===Former Township=== |
===Former Township=== |
||
*[[Belleville Township, St. Clair County, Illinois|Belleville]]<ref>{{cite web|url=http://www.bnd.com/news/local/community/belleville/article150703982.html|title=Belleville officially takes over township's duties|website=bnd.com|access-date= |
*[[Belleville Township, St. Clair County, Illinois|Belleville]]<ref>{{cite web|url=http://www.bnd.com/news/local/community/belleville/article150703982.html|title=Belleville officially takes over township's duties|website=bnd.com|access-date=March 27, 2018}}</ref> |
||
Former Communities |
Former Communities |
||
| Line 328: | Line 335: | ||
==Education== |
==Education== |
||
Here is a list of school districts with any territory in the county, no matter how slight, even if the schools and/or administrative offices are located in other counties:<ref>{{cite web|url=https://www2.census.gov/geo/maps/DC2020/PL20/st17_il/schooldistrict_maps/c17163_st_clair/DC20SD_C17163.pdf|title=2020 CENSUS - SCHOOL DISTRICT REFERENCE MAP: St. Clair County, IL|publisher=[[U.S. Census Bureau]]|accessdate= |
Here is a list of school districts with any territory in the county, no matter how slight, even if the schools and/or administrative offices are located in other counties:<ref>{{cite web|url=https://www2.census.gov/geo/maps/DC2020/PL20/st17_il/schooldistrict_maps/c17163_st_clair/DC20SD_C17163.pdf|title=2020 CENSUS - SCHOOL DISTRICT REFERENCE MAP: St. Clair County, IL|publisher=[[U.S. Census Bureau]]|accessdate=July 19, 2022}} - [https://www2.census.gov/geo/maps/DC2020/PL20/st17_il/schooldistrict_maps/c17163_st_clair/DC20SD_C17163_SD2MS.txt Text list]</ref> |
||
; K-12 school districts |
; K-12 school districts |
||
* [[Brooklyn Community Unit School District 188]] |
* [[Brooklyn Community Unit School District 188]] |
||
Revision as of 01:24, 24 April 2024
St. Clair County | |
|---|---|
 St. Clair County Courthouse in Belleville | |
 Flag  Seal | |
 Location within the U.S. state of Illinois | |
 Illinois's location within the U.S. | |
| Coordinates: 38°28′N 89°56′W / 38.47°N 89.93°W | |
| Country | |
| State | |
| Founded | 1790 |
| Named for | Arthur St. Clair |
| Seat | Belleville |
| Largest city | Belleville |
| Area | |
| • Total | 674 sq mi (1,750 km2) |
| • Land | 658 sq mi (1,700 km2) |
| • Water | 16 sq mi (40 km2) 2.4% |
| Population (2020) | |
| • Total | 257,400 |
| • Density | 380/sq mi (150/km2) |
| Time zone | UTC−6 (Central) |
| • Summer (DST) | UTC−5 (CDT) |
| Congressional districts | 12th, 13th |
| Website | www |


St. Clair County is the ninth most populous county in Illinois. Located directly east of St. Louis, the county is part of the Metro East region of the Greater St. Louis metropolitan area in southern Illinois. As of the 2020 United States census, St. Clair County had a population of 257,400, making it the third most populous county in Illinois outside the Chicago metropolitan area. Belleville is the county’s seat and largest city.[1]
Cahokia Village was founded in 1697 by French settlers and served as a Jesuit mission to convert tribes of the Illinois Confederation to Christianity. Prior to the establishment of Illinois as a state, the government of the Northwest Territory created St. Clair County in 1790 out of the western half of Knox County. In 1809, the county became the administrative center of the Illinois Territory and one of the two original counties of Illinois, alongside Randolph County.
In 1970, the United States Census Bureau placed the mean center of U.S. population in St. Clair County.[2]
History
This area was occupied for thousands of years by cultures of indigenous peoples. The first modern explorers and colonists of the area were French and French Canadians, founding a mission settlement in 1697 now known as Cahokia Village. After Great Britain defeated France in the Seven Years' War in 1763 and absorbed its territory in North America east of the Mississippi River, British-American colonists began to move into the area. Many French Catholics moved to settlements west of the river rather than live under British Protestant rule.
After the United States achieved independence in the late 18th century, St. Clair County was the first county established in present-day Illinois; it antedates Illinois' existence as a separate jurisdiction. The county was established in 1790 by a proclamation of Arthur St. Clair, first governor of the Northwest Territory, who named it after himself.
The original boundary of St. Clair county covered a large area between the Mackinaw and Ohio rivers. In 1801, Governor William Henry Harrison re-established St. Clair County as part of the Indiana Territory, extending its northern border to Lake Superior and the international border with Rupert's Land.[3]
When the Illinois Territory was created in 1809, Territorial Secretary Nathaniel Pope, in his capacity as acting governor, issued a proclamation establishing St. Clair and Randolph County as the two original counties of Illinois.
-
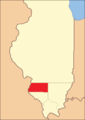
![St. Clair County as it was re-established in 1809. This diagonal border line had been drawn by the Indiana Territorial government in 1803.[3]](https://upload.wikimedia.org/wikipedia/commons/thumb/0/0c/St._Clair_County_Illinois_1809.png/85px-St._Clair_County_Illinois_1809.png) St. Clair County as it was re-established in 1809. This diagonal border line had been drawn by the Indiana Territorial government in 1803.[3]
St. Clair County as it was re-established in 1809. This diagonal border line had been drawn by the Indiana Territorial government in 1803.[3] -
 St. Clair County between 1812 and 1813
 -
 St. Clair County between 1813 and 1816
 -
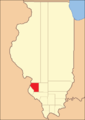
 St. Clair County between 1816 and 1818
 -
 St. Clair County between 1818 and 1825
 -
 St. Clair County between 1825 and 1827
 -
 St. Clair County from 1827 to present
![St. Clair County as it was re-established in 1809. This diagonal border line had been drawn by the Indiana Territorial government in 1803.[3]](https://trans.hiragana.jp/ruby/https://en.wikipedia.org/wiki/File:St._Clair_County_Illinois_1809.png)


Originally developed for agriculture, this area became industrialized and urbanized in the area of East St. Louis, Illinois, a city that developed on the east side of the Mississippi River from St. Louis, Missouri. It was always strongly influenced by actions of businessmen from St. Louis, who were initially French Creole fur traders with western trading networks.
In the 19th century, industrialists from St. Louis put coal plants and other heavy industry on the east side of the river, developing East St. Louis. Coal from southern mines was transported on the river to East St. Louis, then fed by barge to St. Louis furnaces as needed. After bridges spanned the river, industry expanded.
In the late 19th and early 20th centuries, the cities attracted immigrants from southern and eastern Europe and from the South. In 1910 there were 6,000 African Americans in the city. With the Great Migration underway from the rural South, to leave behind Jim Crow and disenfranchisement, by 1917, the African-American population in East St. Louis had doubled. Whites were generally hired first and given higher–paying jobs, but there were still opportunities for American blacks. If hired as strikebreakers, they were resented by white workers, and both groups competed for jobs and limited housing in East St. Louis. The city had not been able to keep up with the rapid growth of population. The United States was developing war industries to support its eventual entry into the Great War, now known as World War I.
In February 1917 tensions in the city arose as white workers struck at the Aluminum Ore Company. Employers fiercely resisted union organizing, sometimes with violence. In this case they hired hundreds of blacks as strikebreakers. White workers complained to the city council about this practice in late May. Rumors circulated about an armed African American man robbing a white man, and whites began to attack blacks on the street. The governor ordered in the National Guard and peace seemed restored by early June.
"On July 1, a white man in a Ford shot into black homes. Armed African-Americans gathered in the area and shot into another oncoming Ford, killing two men who turned out to be police officers investigating the shooting."[4] Word spread and whites gathered at the Labor Temple; the next day they fanned out across the city, armed with guns, clubs, anything they could use against the blacks they encountered. From July 1 through July 3, 1917, the East St. Louis riots engulfed the city, with whites attacking blacks throughout the city, pulling them from streetcars, shooting and hanging them, burning their houses. During this period, some African Americans tried to swim or use boats to get to safety; thousands crossed the Eads Bridge to St. Louis, seeking refuge, until the police closed it off. The official death toll was 39 blacks and nine whites, but some historians believe more blacks were killed.[4] Because the riots were racial terrorism, the Equal Justice Initiative has included these deaths among the lynchings of African Americans in the state of Illinois in its 2017 3rd edition of its report, Lynching in America.[5]
The riots had disrupted East St. Louis, which had seemed to be on the rise as a flourishing industrial city. In addition to the human toll, they cost approximately $400,000 in property damage[6] (over $8 million, in 2017 US Dollars [7]). They have been described as among the worst labor and race-related riots in United States history, and they devastated the African-American community.
Rebuilding was difficult as workers were being drafted to fight in World War I. When the veterans returned, they struggled to find jobs and re-enter the economy, which had to shift down to peacetime.
In the late 20th century, national restructuring of heavy industry cost many jobs, hollowing out the city, which had a marked decline in population. Residents who did not leave have suffered high rates of poverty and crime. In the early 21st century, East St. Louis is a site of urban decay. Swathes of deteriorated housing were demolished and parts of the city have become urban prairie. In 2017 the city marked the centennial of the riots that had so affected its residents.
Other cities in St. Clair County border agricultural or vacant lands. Unlike the suburbs on the Missouri side of the metro area, those in Metro-East are typically separated by agriculture, or otherwise undeveloped land left after the decline of industry. The central portion of St. Clair county is located on a bluff along the Mississippi River. This area is being developed with suburban housing, particularly in Belleville, and its satellite cities. The eastern and southern portion of the county is sparsely populated. The older small communities and small tracts of newer suburban villages are located between large areas of land devoted to corn and soybean fields, the major commodity crops of the area.
According to the St. Clair County Historical Society, the county flag was designed in 1979 by Kent Zimmerman, a senior at O'Fallon Township High School. Zimmerman's flag won first place in a contest against submissions by more than 40 grade school and high school students from throughout the county. The winning entry features the outline of St. Clair County with an orange moon, a stalk of corn, and a pickaxe against a background of three stripes alternating green, yellow, and green.
Geography
According to the US Census Bureau, the county has a total area of 674 square miles (1,750 km2), of which 658 square miles (1,700 km2) is land and 16 square miles (41 km2) (2.4%) is water.[8]
Climate and weather
| Belleville, Illinois | ||||||||||||||||||||||||||||||||||||||||||||||||||||||||||||
|---|---|---|---|---|---|---|---|---|---|---|---|---|---|---|---|---|---|---|---|---|---|---|---|---|---|---|---|---|---|---|---|---|---|---|---|---|---|---|---|---|---|---|---|---|---|---|---|---|---|---|---|---|---|---|---|---|---|---|---|---|
| Climate chart (explanation) | ||||||||||||||||||||||||||||||||||||||||||||||||||||||||||||
| ||||||||||||||||||||||||||||||||||||||||||||||||||||||||||||
| ||||||||||||||||||||||||||||||||||||||||||||||||||||||||||||
In recent years, average temperatures in the county seat of Belleville have ranged from a low of 22 °F (−6 °C) in January to a high of 90 °F (32 °C) in July, although a record low of −27 °F (−33 °C) was recorded in January 1977 and a record high of 117 °F (47 °C) at East St. Louis, Illinois was recorded in July 1954.[10][11][12] Average monthly precipitation ranged from 2.02 inches (51 mm) in January to 4.18 inches (106 mm) in May.[9]
Transportation
Major highways
 Interstate 55
 Interstate 64
 Interstate 70
 Interstate 255
 U.S. Highway 40
 U.S. Highway 50
 Illinois Route 3
 Illinois Route 4
 Illinois Route 13
 Illinois Route 15
 Illinois Route 111
 Illinois Route 156
 Illinois Route 157
 Illinois Route 158
 Illinois Route 159
 Illinois Route 161
 Illinois Route 163
 Illinois Route 177
 Illinois Route 203
Public transit

St. Clair County is home to 11 St. Louis MetroLink stations on the Red and Blue Lines.
St. Clair County is also served by Metrobus and Madison County Transit.
Adjacent counties and city
- Madison County (north)
- Clinton County (northeast)
- Washington County (east)
- Randolph County (south)
- Monroe County (southwest)
- St. Louis, Missouri (west)
- St. Louis County, Missouri (west)
Demographics
| Census | Pop. | Note | %± |
|---|---|---|---|
| 1820 | 5,253 | — | |
| 1830 | 7,078 | 34.7% | |
| 1840 | 13,631 | 92.6% | |
| 1850 | 20,180 | 48.0% | |
| 1860 | 37,694 | 86.8% | |
| 1870 | 51,068 | 35.5% | |
| 1880 | 61,806 | 21.0% | |
| 1890 | 66,571 | 7.7% | |
| 1900 | 86,685 | 30.2% | |
| 1910 | 119,870 | 38.3% | |
| 1920 | 136,520 | 13.9% | |
| 1930 | 157,775 | 15.6% | |
| 1940 | 166,899 | 5.8% | |
| 1950 | 205,995 | 23.4% | |
| 1960 | 262,509 | 27.4% | |
| 1970 | 285,176 | 8.6% | |
| 1980 | 267,531 | −6.2% | |
| 1990 | 262,852 | −1.7% | |
| 2000 | 256,082 | −2.6% | |
| 2010 | 270,056 | 5.5% | |
| 2020 | 257,400 | −4.7% | |
| 2023 (est.) | 251,018 | [13] | −2.5% |
| US Decennial Census[14] 1790-1960[15] 1900-1990[16] 1990-2000[17] 2010-2019[18] | |||
In the 2020 United States Census the racial makeup of the county was 59.6% White, 29.7% black or African American, 1.4% Asian, 0.3% American Indian, 0.1% Pacific islander, 2.1% from other races, and 6.8% from two or more races. 4.9% were of Hispanic or Latino origin.[19]
As of the 2010 United States Census, there were 270,056 people, 105,045 households, and 70,689 families residing in the county.[20] The population density was 410.6 inhabitants per square mile (158.5/km2). There were 116,249 housing units at an average density of 176.7 per square mile (68.2/km2).[8] The racial makeup of the county was 64.6% white, 30.5% black or African American, 1.2% Asian, 0.2% American Indian, 0.1% Pacific islander, 1.2% from other races, and 2.2% from two or more races. Those of Hispanic or Latino origin made up 3.3% of the population. In terms of ancestry, 27.5% were German, 11.1% were Irish, 7.4% were English, and 4.6% were American.[21]
Of the 105,045 households, 34.7% had children under the age of 18 living with them, 44.6% were married couples living together, 17.7% had a female householder with no husband present, 32.7% were non-families, and 27.5% of all households were made up of individuals. The average household size was 2.53 and the average family size was 3.09. The median age was 36.9 years.
The median income for a household in the county was $48,562 and the median income for a family was $61,042. Males had a median income of $47,958 versus $34,774 for females. The per capita income for the county was $24,770. About 12.3% of families and 15.5% of the population were below the poverty line, including 24.7% of those under age 18 and 9.7% of those age 65 or over.[22]
Government and infrastructure
The Southwestern Illinois Correctional Center, operated by the Illinois Department of Corrections, is near East St. Louis.[23]
Also located in St. Clair County is Scott Air Force Base, which is home to U.S. Transportation Command, the Air Force's Air Mobility Command, and the Military Surface Deployment and Distribution Command.
Politics
St. Clair County is a reliably Democratic county, having voted for the Democratic presidential candidate in every presidential election since 1928, with the exception of the 1972 United States presidential election.
| Year | Republican | Democratic | Third party | |||
|---|---|---|---|---|---|---|
| No. | % | No. | % | No. | % | |
| 2020 | 57,150 | 44.47% | 68,325 | 53.17% | 3,030 | 2.36% |
| 2016 | 53,857 | 44.35% | 60,756 | 50.03% | 6,823 | 5.62% |
| 2012 | 50,125 | 41.83% | 67,285 | 56.15% | 2,417 | 2.02% |
| 2008 | 47,958 | 38.05% | 76,160 | 60.42% | 1,936 | 1.54% |
| 2004 | 50,203 | 44.35% | 62,410 | 55.14% | 576 | 0.51% |
| 2000 | 42,299 | 42.13% | 55,961 | 55.74% | 2,133 | 2.12% |
| 1996 | 33,066 | 35.02% | 53,405 | 56.56% | 7,958 | 8.43% |
| 1992 | 31,951 | 29.71% | 57,625 | 53.58% | 17,965 | 16.71% |
| 1988 | 41,439 | 42.58% | 55,465 | 57.00% | 409 | 0.42% |
| 1984 | 51,046 | 49.01% | 52,294 | 50.21% | 808 | 0.78% |
| 1980 | 46,063 | 45.76% | 50,046 | 49.71% | 4,564 | 4.53% |
| 1976 | 40,333 | 39.91% | 59,177 | 58.55% | 1,555 | 1.54% |
| 1972 | 50,519 | 51.50% | 46,636 | 47.54% | 942 | 0.96% |
| 1968 | 34,442 | 34.14% | 50,726 | 50.29% | 15,706 | 15.57% |
| 1964 | 28,226 | 27.61% | 74,005 | 72.39% | 0 | 0.00% |
| 1960 | 42,046 | 38.31% | 67,367 | 61.38% | 338 | 0.31% |
| 1956 | 41,528 | 42.77% | 55,295 | 56.94% | 283 | 0.29% |
| 1952 | 39,713 | 39.51% | 60,311 | 60.01% | 479 | 0.48% |
| 1948 | 30,883 | 36.07% | 54,260 | 63.38% | 474 | 0.55% |
| 1944 | 33,557 | 40.82% | 48,325 | 58.78% | 327 | 0.40% |
| 1940 | 35,998 | 40.05% | 53,482 | 59.50% | 411 | 0.46% |
| 1936 | 26,684 | 31.86% | 54,238 | 64.75% | 2,840 | 3.39% |
| 1932 | 22,744 | 31.34% | 47,305 | 65.18% | 2,522 | 3.48% |
| 1928 | 31,026 | 45.60% | 36,374 | 53.46% | 637 | 0.94% |
| 1924 | 23,380 | 45.85% | 14,921 | 29.26% | 12,693 | 24.89% |
| 1920 | 21,681 | 51.34% | 14,032 | 33.23% | 6,518 | 15.43% |
| 1916 | 22,134 | 47.70% | 22,622 | 48.75% | 1,650 | 3.56% |
| 1912 | 8,156 | 31.53% | 10,826 | 41.85% | 6,884 | 26.61% |
| 1908 | 12,619 | 48.66% | 11,342 | 43.73% | 1,973 | 7.61% |
| 1904 | 11,926 | 55.31% | 8,200 | 38.03% | 1,435 | 6.66% |
| 1900 | 9,764 | 48.67% | 9,827 | 48.98% | 472 | 2.35% |
| 1896 | 8,960 | 50.96% | 8,345 | 47.46% | 278 | 1.58% |
| 1892 | 6,276 | 44.72% | 7,207 | 51.35% | 551 | 3.93% |
Communities
Cities
Villages
Census-designated places
Unincorporated communities
Townships
Former Township
Former Communities
Islands
Education
Here is a list of school districts with any territory in the county, no matter how slight, even if the schools and/or administrative offices are located in other counties:[26]
- K-12 school districts
- Brooklyn Community Unit School District 188
- Cahokia Community Unit School District 187
- Collinsville Community Unit School District 10
- Columbia Community Unit School District 4
- Dupo Community Unit School District 196
- East St. Louis School District 189
- Lebanon Community Unit School District 9
- Marissa Community Unit School District 40
- Mascoutah Community Unit School District 19
- New Athens Community Unit School District 60
- Red Bud Community Unit School District 132
- Waterloo Community Unit School District 5
- Wesclin Community Unit School District 3
- Secondary school districts
- Belleville Township High School District 201
- Freeburg Community High School District 77
- O'Fallon Township High School District 203
- Elementary school districts
- Belle Valley School District 11
- Belleville School District 118
- Central School District 104
- Harmony Emge School District 175
- Freeburg Community Consolidated School District 70
- Grant Community Consolidated School District 110
- High Mount School District 116
- Millstadt Consolidated Community School District 160
- O'Fallon Community Consolidated School District 90
- Pontiac-William Holliday School District 105
- Shiloh Village School District 85
- Signal Hill School District 181
- Smithton Community Consolidated School District 130
- St. Libory Consolidated School District 30
- Whiteside School District 115
- Wolf Branch School District 113
See also
References
- ^ "Find a County". National Association of Counties. Retrieved June 7, 2011.
- ^ "Mean Center of Population for the United States: 1790 to 2000" (PDF). US Census Bureau. Archived from the original (PDF) on November 3, 2001. Retrieved September 17, 2011.
- ^ a b White, Jesse. Origin and Evolution of Illinois Counties. State of Illinois, March 2010. [1]
- ^ a b Alison Keyes, "The East St. Louis Race Riot Left Dozens Dead, Devastating a Community on the Rise", Smithsonian Magazine, June 30, 2017; accessed May 26, 2018
- ^ "Lynching in America/Supplement by County, 3rd ed. (2017) p. 4" (PDF). Archived from the original (PDF) on October 23, 2017. Retrieved July 5, 2018.
- ^ "The Negro Silent Protest Parade organized by the NAACP Fifth Ave., New York City July 28, 1917" (PDF). National Humanities Center, Research Triangle Park, NC. National Humanities Center. 2014. Retrieved July 28, 2017.
- ^ "Calculate the value of $400,000 in 1917". www.dollartimes.com.
- ^ a b "Population, Housing Units, Area, and Density: 2010 - County". US Census Bureau. Archived from the original on February 12, 2020. Retrieved July 12, 2015.
- ^ a b "Monthly Averages for Belleville IL". The Weather Channel. Retrieved January 27, 2011.
- ^ Westcott, Nancy E. (July 2011). "The Prolonged 1954 Midwestern US Heat Wave: Impacts and Responses". Wea. Climate Soc. 3 (3): 165–76. doi:10.1175/WCAS-D-10-05002.1.
- ^ "Lessons Learned from 1950s' Heat Wave Show Planning Needed for Future Severe Events" (Press release). Illinois State Water Survey. May 18, 2011. Archived from the original on April 15, 2012. Retrieved November 4, 2011.
- ^ Westcott, Nancy (January 19, 2010). "Impacts of the 1954 Heat Wave". 18th Conference on Applied Climatology. Atlanta GA: American Meteorological Society.
- ^ "Annual Estimates of the Resident Population for Counties: April 1, 2020 to July 1, 2023". United States Census Bureau. Retrieved April 2, 2024.
- ^ "US Decennial Census". US Census Bureau. Retrieved July 8, 2014.
- ^ "Historical Census Browser". University of Virginia Library. Retrieved July 8, 2014.
- ^ "Population of Counties by Decennial Census: 1900 to 1990". US Census Bureau. Retrieved July 8, 2014.
- ^ "Census 2000 PHC-T-4. Ranking Tables for Counties: 1990 and 2000" (PDF). US Census Bureau. Retrieved July 8, 2014.
- ^ "State & County QuickFacts". US Census Bureau. Archived from the original on June 7, 2011. Retrieved July 8, 2014.
- ^ "St. Clair County, Illinois". US Census Bureau. Retrieved January 9, 2020.
- ^ "Profile of General Population and Housing Characteristics: 2010 Demographic Profile Data". US Census Bureau. Archived from the original on February 13, 2020. Retrieved July 12, 2015.
- ^ "Selected Social Characteristics in the United States – 2006-2010 American Community Survey 5-Year Estimates". US Census Bureau. Archived from the original on February 13, 2020. Retrieved July 12, 2015.
- ^ "Selected Economic Characteristics – 2006-2010 American Community Survey 5-Year Estimates". US Census Bureau. Archived from the original on February 13, 2020. Retrieved July 12, 2015.
- ^ Southwestern Illinois Correctional Center. IL Dept of Corrections. Retrieved on July 10, 2010.
- ^ Leip, David. "Atlas of US Presidential Elections". uselectionatlas.org. Retrieved March 27, 2018.
- ^ "Belleville officially takes over township's duties". bnd.com. Retrieved March 27, 2018.
- ^ "2020 CENSUS - SCHOOL DISTRICT REFERENCE MAP: St. Clair County, IL" (PDF). U.S. Census Bureau. Retrieved July 19, 2022. - Text list
External links
- A Brief History of St. Clair County, Illinois from rootsweb.com
- St. Clair County Historical Society & Research Library
Places adjacent to St. Clair County, Illinois | ||||||||||||||||
|---|---|---|---|---|---|---|---|---|---|---|---|---|---|---|---|---|
| ||||||||||||||||
| Topics |  | |
|---|---|---|
| Central city | ||
| Largest cities (over 50,000 in 2020) | ||
| Medium-sized cities (over 20,000 in 2020) | ||
| Largest towns and villages (over 10,000 in 2020) |
| |
| Missouri counties | ||
| Illinois counties | ||
| Subregions | ||
Municipalities and communities of St. Clair County, Illinois, United States | ||
|---|---|---|
| Cities |  | |
| Villages | ||
| Townships | ||
| CDPs | ||
| Other unincorporated communities | ||
| Footnotes | ‡This populated place also has portions in an adjacent county or counties | |
| Counties |  | |
|---|---|---|
| Major cities (25,000+) | ||
| Cities (5,000-25,000) | ||
| Communities (1,000-5,000) |
| |
| Transit systems | ||
| Amtrak stations |
| |
| Interstates | ||
| Airports | ||
| Colleges | ||
| Sports teams |
| |
| Counties |  | |
|---|---|---|
| Mid-sized cities (25,000+) | ||
| Small cities (10,000-25,000) | ||
| Small cities (5,000-10,000) | ||
| Transit systems | ||
| Amtrak stations | ||
| Interstates | ||
| Airports/military bases |
| |
| Universities | ||
| Colleges | ||
| Sports teams based in Southern Illinois | ||
| International | |
|---|---|
| National | |
| Geographic | |
| Other | |