
Mixed (United Kingdom ethnicity category): Difference between revisions
m →Statistics: Mixed White and Black African |
m v2.05b - Bot T20 CW#61 - Fix errors for CW project (Reference before punctuation) |
||
| (59 intermediate revisions by 21 users not shown) | |||
| Line 1: | Line 1: | ||
{{short description|Ethnicity category}} |
|||
{{Use dmy dates|date=November 2020}} |
{{Use dmy dates|date=November 2020}} |
||
{{Infobox ethnic group |
{{Infobox ethnic group |
||
|group = Mixed |
|group = Mixed |
||
| image = File:Counties of the UK Mixed.svg |
|||
|population = '''United Kingdom 1,250,229'''<ref name=2011censusUK>{{cite web|url=http://www.ons.gov.uk/ons/rel/census/2011-census/key-statistics-and-quick-statistics-for-local-authorities-in-the-united-kingdom---part-1/rft-ks201uk.xls|title=2011 Census: Ethnic group, local authorities in the United Kingdom|publisher=Office for National Statistics|date=11 October 2013}}</ref><br>'''[[England]] 1,192,879 (2011)'''<ref name=2011census>[http://www.ons.gov.uk/ons/rel/census/2011-census/key-statistics-for-local-authorities-in-england-and-wales/rft-table-ks201ew.xls 2011 Census: Ethnic group, local authorities in England and Wales, Accessed 27 December 2012]</ref><br />Mixed White and Black Caribbean – 426,715<br />[[Mixed White and Black African]] – 165,974<br />Mixed White and Asian – 341,727<br />Other Mixed – 289,984<br />'''[[Wales]] 31,521 (2011)'''<ref name=2011census/><br />'''[[Scotland]] 19,815 (2011)'''<ref name=2011censusUK/><br />'''[[Northern Ireland]] 6,014 (2011)'''<ref>[http://www.ninis2.nisra.gov.uk/public/pivotgrid.aspx?dataSetVars=ds-2345-lh-37-yn-2011-sk-136-sn-Census%202011-yearfilter-- 2011 census NIRSA Ethnic Group: KS201NI (administrative geographies)], Accessed 27 December 2012</ref> |
|||
| image_caption = Distribution by local authority in the 2011 census |
|||
| population = {{flagicon|United Kingdom}} '''United Kingdom: 1,793,257 – 2.7% ([[2021 United Kingdom census|2021/22 Census]])'''<br/>{{Flag|England}}: 1,669,378 – 3.0% (2021)<ref name=2021census>{{cite web|url=https://www.ons.gov.uk/peoplepopulationandcommunity/culturalidentity/ethnicity/bulletins/ethnicgroupenglandandwales/census2021|title=Ethnic group, England and Wales: Census 2021|publisher=Office for National Statistics|access-date=29 November 2022}}</ref><br>{{Flag|Wales}}: 48,598 – 1.6% (2021)<ref name=2021census/><br/> |
|||
'''England and Wales by Mixed Ethnicities (2021)''' {{Collapsible list |
|||
| |
|||
*White and Black Caribbean: 513,040 |
|||
*White and Asian: 488,228 |
|||
*Other Mixed or Multiple Ethnic Groups: 467,116 |
|||
*[[Mixed White and Black African people in the United Kingdom|White and Black African]]: 249,593}} |
|||
{{Flag|Scotland}}: 60,899 – 1.1% (2022)<ref name="2022census_Scot">{{cite web |url=https://www.scotlandscensus.gov.uk/media/trbdxzme/scotland-s-census-2022-ethnic-group-national-identity-language-and-religion-chart-data.xlsx |title=Scotland's Census 2022 - Ethnic group, national identity, language and religion - Chart data |author=<!--Not stated--> |date=21 May 2024 |website=Scotland's Census |publisher=[[National Records of Scotland]] |access-date=21 May 2024 }} [https://www.scotlandscensus.gov.uk/search-the-census#/search-by Alternative URL] 'Search data by location' > 'All of Scotland' > 'Ethnic group, national identity, language and religion' > 'Ethnic Group'</ref><br>[[Northern Ireland]]: 14,382 – 0.8% (2021)<ref name=NICensus2021>{{cite web|url=https://www.nisra.gov.uk/system/files/statistics/census-2021-ms-b01.xlsx|title=MS-B01: Ethnic group|publisher=Northern Ireland Statistics and Research Agency|date= 22 September 2022|accessdate=7 January 2023}}</ref> |
|||
| popplace = <!-- The eight most populous local authorities based on the 2021 census, with the exception of London which is treated as a city --> {{hlist|[[London]]|[[Birmingham]]|[[Hertfordshire]]|[[Surrey]]|[[Essex]]|[[Kent]]|[[Manchester]]|[[Leeds]]}} |
|||
| rels = Predominantly [[Irreligion in the United Kingdom|Irreligious]] (43.6%) or [[History of Christianity in Britain|Christianity]] (36.7%); minority follows [[Islam in the United Kingdom|Islam]] (8.4%) and [[Religion in the United Kingdom|other faiths]] (3.0%){{efn|Including [[Buddhism in the United Kingdom|Buddhism]] (0.6%), [[Hinduism in the United Kingdom|Hinduism]] (0.6%), [[Sikhism in the United Kingdom|Sikhism]] (0.4%) and [[History of the Jews in the United Kingdom|Judaism]] (0.4%)}}<br /><small>2021 census, NI, England and Wales only</small><ref name="ReligionNI2021">{{cite United Kingdom census |url=https://build.nisra.gov.uk/en/custom/data?d=PEOPLE&v=ETHNIC_GROUP_INTERMEDIATE&v=RELIGION_BELONG_TO_AGG19 |table=DT-0036 - Ethnic group by religion |year=2021 |publisher= Northern Ireland Statistics and Research Agency |access-date=30 June 2023}}</ref><ref name="Religion_E&W21">{{cite web |title=RM031 Ethnic group by religion |url=https://www.ons.gov.uk/datasets/RM031/editions/2021/versions/1/filter-outputs/217f1401-dab4-43d3-aa77-6c9382220c0c#summary |publisher=Office for National Statistics |access-date=28 March 2023}}</ref>{{reflist|group=note}} |
|||
}} |
}} |
||
'''Mixed''' is an [[Classification of ethnicity in the United Kingdom| |
'''Mixed''' is an [[Classification of ethnicity in the United Kingdom|ethnic group category]] that was first introduced by the [[United Kingdom]]'s [[Office for National Statistics]] for the [[2001 United Kingdom census|2001 Census]]. Colloquially, it refers to British citizens or residents whose parents are of two or more [[Race (classification of human beings)|races]] or [[Ethnic group|ethnic]] backgrounds. The Mixed or Multiple ethnic group numbered just under 1.8 million in the [[2021 United Kingdom census]] or 2.7% of the total UK population.<ref>{{Cite web |date=29 November 2022 |title=Office for National Statistics (ONS), released 29 November 2022, ONS website, statistical bulletin, Ethnic group, England and Wales: Census 2021 |url=https://www.ons.gov.uk/peoplepopulationandcommunity/culturalidentity/ethnicity/bulletins/ethnicgroupenglandandwales/census2021 |access-date=29 November 2022 |website=Office for National Statistics}}</ref><ref name="2022census_Scot"/><ref name=NICensus2021/> |
||
==Statistics== |
==Statistics== |
||
A number of academics have pointed out that the ethnicity classification employed in the census and other official statistics in the UK since 1991 involve confusion between the concepts of ethnicity and [[Race (human classification)|race]].<ref>{{cite journal|title=Negotiating race and ethnicity: Exploring the implications of the 1991 census|first=Roger|last=Ballard|journal=Patterns of Prejudice|volume=30|issue=3|year=1996|pages=3–33|doi=10.1080/0031322X.1996.9970192|url=http://crossasia-repository.ub.uni-heidelberg.de/288/1/negotiating.pdf}}</ref><ref name=Kertzer>{{cite book|title=Census and Identity: The Politics of Race, Ethnicity, and Language in National Censuses|url=https://archive.org/details/censusidentitypo00kert|url-access=limited|chapter=Censuses, identity formation, and the struggle for political power|year=2002|first1=David I.|last1=Kertzer|first2=Dominique|last2=Arel|editor-first1=David I.|editor-last1=Kertzer|editor-first2=Dominique|editor-last2=Arel|location=Cambridge|publisher=Cambridge University Press|pages=[https://archive.org/details/censusidentitypo00kert/page/n14 1]–42}}</ref> Aspinall notes that sustained academic attention has been focused on "how the censuses measure ethnicity, especially the use of dimensions that many claim have little to do with ethnicity, such as skin colour, race, and nationality".<ref name=Aspinall>{{cite journal|title=Answer Formats in British Census and Survey Ethnicity Questions: Does Open Response Better Capture 'Superdiversity'?|first=Peter J|last=Aspinall|journal=Sociology|volume=46|issue=2|year=2012|pages=354–364|doi=10.1177/0038038511419195}}</ref> |
A number of academics have pointed out that the ethnicity classification employed in the census and other official statistics in the UK since 1991 involve confusion between the concepts of ethnicity and [[Race (human classification)|race]].<ref>{{cite journal|title=Negotiating race and ethnicity: Exploring the implications of the 1991 census|first=Roger|last=Ballard|journal=Patterns of Prejudice|volume=30|issue=3|year=1996|pages=3–33|doi=10.1080/0031322X.1996.9970192|url=http://crossasia-repository.ub.uni-heidelberg.de/288/1/negotiating.pdf}}</ref><ref name=Kertzer>{{cite book|title=Census and Identity: The Politics of Race, Ethnicity, and Language in National Censuses|url=https://archive.org/details/censusidentitypo00kert|url-access=limited|chapter=Censuses, identity formation, and the struggle for political power|year=2002|first1=David I.|last1=Kertzer|first2=Dominique|last2=Arel|editor-first1=David I.|editor-last1=Kertzer|editor-first2=Dominique|editor-last2=Arel|location=Cambridge|publisher=Cambridge University Press|pages=[https://archive.org/details/censusidentitypo00kert/page/n14 1]–42}}</ref> Aspinall notes that sustained academic attention has been focused on "how the censuses measure ethnicity, especially the use of dimensions that many claim have little to do with ethnicity, such as skin colour, race, and nationality".<ref name=Aspinall>{{cite journal|title=Answer Formats in British Census and Survey Ethnicity Questions: Does Open Response Better Capture 'Superdiversity'?|first=Peter J|last=Aspinall|journal=Sociology|volume=46|issue=2|year=2012|pages=354–364|doi=10.1177/0038038511419195|s2cid=144841712 }}</ref> |
||
2001 was the first census which asked about mixed race identity. In that census, 677,177 classified themselves as of mixed ethnicity, making up 1.2 percent of the |
The year 2001 was the first census which asked about mixed race identity. In that census, 677,177 classified themselves as of mixed ethnicity, making up 1.2 percent of the country's population.<ref name="2001 census">{{cite news|url=http://www.statistics.gov.uk/CCI/nugget.asp?ID=273|title=Population size: 7.9% from a minority ethnic group|date=13 February 2003|publisher=Office for National Statistics}}</ref> The 2011 Census gave the figure as 2.2% for England and Wales.<ref name="UK Government Ethnicity Figures">{{cite web|url=https://www.ethnicity-facts-figures.service.gov.uk/uk-population-by-ethnicity/national-and-regional-populations/population-of-england-and-wales/latest#by-ethnicity-over-time|title="Ethnicity Facts and Figures UK Government"|date=22 December 2022 }}</ref> |
||
[[Office for National Statistics]] estimates suggest that 956,700 mixed-ethnicity people were resident in England (as opposed to the whole of the |
[[Office for National Statistics]] estimates suggest that 956,700 mixed-ethnicity people were resident in England (as opposed to the whole of the country) as of mid-2009, compared to 654,000 at mid-2001.<ref name=Estimates>{{cite web|url=http://www.neighbourhood.statistics.gov.uk/dissemination/LeadTableView.do?adminCompAndTimeId=25403%3A280&a=7&b=276743&c=london&d=13&r=1&e=13&f=24438&o=254&g=325264&i=1001x1003x1004x1005&l=1809&m=0&s=1254850916322&enc=1|title=Resident Population Estimates by Ethnic Group, All Persons June 2009|publisher=Office for National Statistics|access-date=28 August 2011}}</ref> As of May 2011, this figure surpassed 1 million.<ref>{{cite news| url=https://www.theguardian.com/society/2011/may/18/non-white-british-population-ons | location=London | work=The Guardian | first=Simon | last=Rogers | title=Non-white British population reaches 9.1 million | date=19 May 2011}}</ref> It was estimated in 2007 that, by 2020, 1.24 million people in the UK would be of mixed race.<ref>{{cite news|url=https://www.theguardian.com/commentisfree/2007/jan/23/post975|title=Mixed messages|last=Smith|first=Laura|date=23 January 2007|work=The Guardian|location=London}}</ref> |
||
Research conducted by the [[BBC]], however, suggests that the mixed race population could already be twice the official estimate figure - up to 2 million.<ref>{{cite news| url=https://www.bbc.co.uk/news/uk-15205803 | work=BBC News | title=Mixed race UK population double official figure, says new report | date=6 October 2011}}</ref> According to ''The Economist'' in October 2020, the 2011 census figure "is probably an undercount, since not all children of mixed marriages will have ticked one of the mixed categories, and the number is likely to have grown since the census".<ref>{{cite news|url=https://www.economist.com/britain/2020/10/03/britains-mixed-race-population-blurs-the-lines-of-identity-politics|title=Britain's mixed-race population blurs the lines of identity politics| |
Research conducted by the [[BBC]], however, suggests that the mixed race population could already be twice the official estimate figure - up to 2 million.<ref>{{cite news| url=https://www.bbc.co.uk/news/uk-15205803 | work=BBC News | title=Mixed race UK population double official figure, says new report | date=6 October 2011}}</ref> According to ''The Economist'' in October 2020, the 2011 census figure "is probably an undercount, since not all children of mixed marriages will have ticked one of the mixed categories, and the number is likely to have grown since the census".<ref>{{cite news|url=https://www.economist.com/britain/2020/10/03/britains-mixed-race-population-blurs-the-lines-of-identity-politics|title=Britain's mixed-race population blurs the lines of identity politics|newspaper=The Economist|date=3 October 2020}}</ref> |
||
3.5 percent of all births in England and Wales in 2005 were mixed-ethnicity babies, with 0.9 percent being 'Mixed White and Black Caribbean', 0.5 percent '[[Mixed White and Black African]]', 0.8 percent 'Mixed White and Asian', and 1.3 percent any other mixed background.<ref name="Births">{{cite journal|last=Moser|first=Kath|author2=Stanfield, Kristina M.|author3=Leon, David A.|year=2008|title=Birthweight and gestational age by ethnic group, England and Wales 2005: Introducing new data on births|journal=Health Statistics Quarterly|volume=39|issue=39|pages=22–31|url=http://www.statistics.gov.uk/articles/hsq/HSQ39Birthwt&Gest_ethnicity.pdf|pmid=18810886|archive-url=https://web.archive.org/web/20090215235418/http://www.statistics.gov.uk/articles/hsq/HSQ39Birthwt%26Gest_ethnicity.pdf|archive-date=15 February 2009|url-status=dead}}</ref> |
3.5 percent of all births in England and Wales in 2005 were mixed-ethnicity babies, with 0.9 percent being 'Mixed White and Black Caribbean', 0.5 percent '[[Mixed White and Black African]]', 0.8 percent 'Mixed White and Asian', and 1.3 percent any other mixed background.<ref name="Births">{{cite journal|last=Moser|first=Kath|author2=Stanfield, Kristina M.|author3=Leon, David A.|year=2008|title=Birthweight and gestational age by ethnic group, England and Wales 2005: Introducing new data on births|journal=Health Statistics Quarterly|volume=39|issue=39|pages=22–31|url=http://www.statistics.gov.uk/articles/hsq/HSQ39Birthwt&Gest_ethnicity.pdf|pmid=18810886|archive-url=https://web.archive.org/web/20090215235418/http://www.statistics.gov.uk/articles/hsq/HSQ39Birthwt%26Gest_ethnicity.pdf|archive-date=15 February 2009|url-status=dead}}</ref> |
||
==Population== |
|||
{| class="wikitable sortable" style="font-size:90%; margin:auto;" |
|||
|+ Mixed population by region and country |
|||
|- |
|||
! rowspan="2" |[[Regions of England|Region]] / [[Countries of the United Kingdom|Country]] |
|||
! colspan="2" |[[2021 United Kingdom census|2021]]{{refn|2021/22: England and Wales,<ref name=2021regionethnic>{{cite web |url=https://www.ons.gov.uk/datasets/TS021/editions/2021/versions/1/filter-outputs/87c867f1-15bc-4f2a-a1ec-51f5a0c2d410 |title= Ethnic group - England and Wales regions |publisher=Office for National Statistics |date=29 November 2022 |access-date=30 November 2022}}</ref> Scotland,<ref name="2022census_Scot"/> and Northern Ireland<ref name=NICensus2021/>}} |
|||
! colspan="2" |[[2011 United Kingdom census|2011]]{{refn|2011: England and Wales,<ref name="QS201EW">{{cite web |title=QS201EW: Ethnic Group |url=https://www.nomisweb.co.uk/census/2011/qs201ew |publisher=Nomis: Official Census and Labour Market Statistics |access-date=30 January 2013}}</ref> Scotland,<ref name="2011census_Scot">{{cite United Kingdom census|url=https://www.scotlandscensus.gov.uk/documents/censusresults/release2a/scotland/KS201SC.pdf|table=Table KS201SC - Ethnic group|publisher=National Records of Scotland|year=2011|archive-url=https://web.archive.org/web/20180704124858/https://www.scotlandscensus.gov.uk/documents/censusresults/release2a/scotland/KS201SC.pdf|archive-date=4 July 2018}}</ref> and Northern Ireland<ref name="NI_2011">{{cite web |title=Ethnic Group - Full Detail: QS201NI |url=http://www.ninis2.nisra.gov.uk/Download/Census%202011_Excel/2011/QS201NI.xls|archive-url=https://web.archive.org/web/20141023054518/https://www.ninis2.nisra.gov.uk/Download/Census%202011_Excel/2011/QS201NI.xls|archive-date=23 October 2014 |access-date=22 July 2014}}</ref>}} |
|||
! colspan="2" |[[2001 United Kingdom census|2001]]{{refn|2001: England and Wales,<ref name="KS006">{{cite web |title=KS006: Ethnic group |url=https://www.nomisweb.co.uk/census/2001/ks006 |publisher=Nomis: Official Census and Labour Market Statistics |access-date=30 June 2003}}</ref> Scotland,<ref name="2001census_Scot">{{cite web|title=Analysis of Ethnicity in the 2001 Census - Summary Report |url=http://www.scotland.gov.uk/Publications/2004/02/18876/32939|access-date=6 September 2014}}</ref> and Northern Ireland<ref name="NI_2001">{{cite web |title=Ethnic Group: KS06 (statistical geographies) |url=http://www.ninis2.nisra.gov.uk/Download/Census%202001_Excel/2001/KS06%20%20(st).xls |archive-url=https://web.archive.org/web/20140730020427/http://www.ninis2.nisra.gov.uk/Download/Census%202001_Excel/2001/KS06%20%20(st).xls|archive-date=30 July 2014 |access-date=22 July 2014}}</ref>}} |
|||
|- |
|||
!Number |
|||
!{{Abbr|%|percentage}} |
|||
!Number |
|||
!{{Abbr|%|percentage}} |
|||
!Number |
|||
!{{Abbr|%|percentage}} |
|||
|- |
|||
|'''{{flag|England}}''' |
|||
| '''1,669,378''' |
|||
| '''2.96%''' |
|||
| '''1,192,879''' |
|||
| '''2.25%''' |
|||
| '''643,373''' |
|||
| '''1.31%''' |
|||
|- |
|||
| —[[Greater London]] |
|||
| 505,775 |
|||
| 5.75% |
|||
| 405,279 |
|||
| 4.96% |
|||
| 226,111 |
|||
| 3.15% |
|||
|- |
|||
| —[[South East England|South East]] |
|||
| 260,871 |
|||
| 2.81% |
|||
| 167,764 |
|||
| 1.94% |
|||
| 85,779 |
|||
| 1.07% |
|||
|- |
|||
| —[[East of England]] |
|||
| 179,654 |
|||
| 2.84% |
|||
| 112,116 |
|||
| 1.92% |
|||
| 57,984 |
|||
| 1.08% |
|||
|- |
|||
| —[[West Midlands (region)|West Midlands]] |
|||
| 178,224 |
|||
| 2.99% |
|||
| 131,714 |
|||
| 2.35% |
|||
| 73,225 |
|||
| 1.39% |
|||
|- |
|||
| —[[North West England|North West]] |
|||
| 163,245 |
|||
| 2.20% |
|||
| 110,891 |
|||
| 1.57% |
|||
| 62,539 |
|||
| 0.93% |
|||
|- |
|||
| —[[East Midlands]] |
|||
| 117,247 |
|||
| 2.40% |
|||
| 86,224 |
|||
| 1.90% |
|||
| 43,141 |
|||
| 1.03% |
|||
|- |
|||
| —[[Yorkshire and the Humber]] |
|||
| 117,017 |
|||
| 2.14% |
|||
| 84,558 |
|||
| 1.60% |
|||
| 44,995 |
|||
| 0.91% |
|||
|- |
|||
|—[[South West England|South West]] |
|||
| 114,074 |
|||
| 2.00% |
|||
| 71,884 |
|||
| 1.36% |
|||
| 37,371 |
|||
| 0.76% |
|||
|- |
|||
|—[[North East England|North East]] |
|||
| 33,271 |
|||
| 1.26% |
|||
| 22,449 |
|||
| 0.86% |
|||
| 12,228 |
|||
| 0.49% |
|||
|- |
|||
|'''{{flag|Scotland}}'''{{Efn|name=Census2021/22|Scotland held its census a year later after the rest of the United Kingdom due to the COVID-19 pandemic. As a result, data shown is for 2022 as opposed to 2021.}} |
|||
| '''60,899''' |
|||
| '''1.12%''' |
|||
| '''19,815''' |
|||
| '''0.37%''' |
|||
| '''12,764''' |
|||
| '''0.25%''' |
|||
|- |
|||
|'''{{flag|Wales}}''' |
|||
| '''48,598''' |
|||
| '''1.56%''' |
|||
| '''31,521''' |
|||
| '''1.03%''' |
|||
| '''17,661''' |
|||
| '''0.61%''' |
|||
|- |
|||
| '''[[Northern Ireland]]''' |
|||
| '''14,382''' |
|||
| '''0.76%''' |
|||
| '''6,014''' |
|||
| '''0.33%''' |
|||
| '''3,319''' |
|||
| '''0.20%''' |
|||
|- |
|||
!'''{{flag|United Kingdom}}''' |
|||
! '''1,793,257''' |
|||
! '''2.68%''' |
|||
! '''1,250,414''' |
|||
! '''1.98%''' |
|||
! '''677,117''' |
|||
! '''1.15%''' |
|||
|- |
|||
|} |
|||
[[File:Mixed British people, 2021 UK Census.png|thumb|Distribution of Mixed British people by local authority, 2021 census]] |
|||
[[File:Mixed population pyramid 2021.svg|thumb|201x201px|Mixed/British Mixed as a total population pyramid in 2021 (in England and Wales)]] |
|||
The [[2021 United Kingdom census]] recorded a population of 1,793,257 or 2.7% of the population in the United Kingdom. When broken down by country, England recorded 1,669,378 (3.0%), Wales recorded 48,598 (1.6%)<ref name=2021census/> and Northern Ireland recorded 14,382 (0.8%).<ref name=NICensus2021/> The equivalent census was recorded a year later in Scotland with a population of 60,899, or 1.1% of the population.<ref name="2022census_Scot"/> The ten local authorities with the largest proportion of those who identified as Mixed were all located in London: [[London Borough of Lambeth|Lambeth]] (8.07%), [[London Borough of Lewisham|Lewisham]] (8.07%), [[London Borough of Croydon|Croydon]] (7.61%), [[London Borough of Islington|Islington]] (7.49%), [[London Borough of Southwark|Southwark]] (7.20%), [[London Borough of Haringey|Haringey]] (7.02%), [[London Borough of Hackney|Hackney]] (6.75%), [[London Borough of Hammersmith and Fulham|Hammersmith and Fulham]] (6.73%), [[Royal Borough of Kensington and Chelsea|Kensington and Chelsea]] (6.64%) and [[London Borough of Camden|Camden]] (6.63%). The three capitals of the other constituent countries of the United Kingdom held the highest proportion of the Mixed population in their respective countries with [[Cardiff]] at 4.00%, [[Edinburgh]] at 2.50%, and [[Belfast]] at 1.20%.<ref name=":2">{{Cite web |title=Ethnic group - Office for National Statistics |url=https://www.ons.gov.uk/datasets/TS021/editions/2021/versions/1/filter-outputs/24422250-263c-4b84-8dd4-6159ee18b8e6#get-data |access-date=2023-01-03 |website=www.ons.gov.uk}}</ref> |
|||
{{Pie chart|thumb=right|caption=Year of arrival (2021 census, England and Wales)<ref>{{Cite web |title=Ethnic group and year of arrival in the uk - Office for National Statistics |url=https://www.ons.gov.uk/datasets/create/filter-outputs/3b1e01ff-adfa-4048-ad0a-9a305cde51d6 |access-date=2023-07-08 |website=www.ons.gov.uk}}</ref>|label1=Born in the UK|value1=81.8|color1=DodgerBlue|label2=Before 1950|value2=0.1|color2=Gray|label3=1951 to 1960|value3=0.4|color3=Green|label4=1961 to 1970|value4=0.8|color4=DarkOrange|label5=1971 to 1980|value5=0.7|color5=DarkKhaki|label6=1981 to 1990|value6=0.9|colour=Khakip|label7=1991 to 2000|value7=2.0|color7=Gold|label8=2001 to 2010|value8=4.2|color8=Chartreuse|label9=2011 to 2021|value9=9.2|color9=DarkRed}} |
|||
{| class="wikitable sortable" style="font-size:90%;" |
|||
|+ Top 15 Areas (2021/22 Census)<ref name="LA_Counties_E&W_21">{{cite web |title=TS021 - Ethnic group |url=https://www.nomisweb.co.uk/datasets/c2021ts021 |publisher=Nomis: Official Census and Labour Market Statistics |access-date=30 March 2023}}</ref><ref name="2022council_Scot">{{cite web |url=https://www.scotlandscensus.gov.uk/media/trbdxzme/scotland-s-census-2022-ethnic-group-national-identity-language-and-religion-chart-data.xlsx |title=Scotland's Census 2022 - Ethnic group, national identity, language and religion - Chart data |author=<!--Not stated--> |date=21 May 2024 |website=Scotland's Census |publisher=[[National Records of Scotland]] |access-date=21 May 2024 }} [https://www.scotlandscensus.gov.uk/search-the-census#/search-by Alternative URL] 'Search data by location' > 'Local Authority (CA2019)' > 'Ethnic group, national identity, language and religion' > 'Ethnic Group'</ref> |
|||
|- |
|||
! Upper tier local authority !! Population !! Percentage |
|||
|- |
|||
| [[Birmingham]] || 55,205 || 4.8% |
|||
|- |
|||
| [[Hertfordshire]] || 45,126 || 3.8% |
|||
|- |
|||
| [[Surrey]] || 40,483 || 3.4% |
|||
|- |
|||
| [[Essex]] || 36,774 || 2.4% |
|||
|- |
|||
| [[Kent]] || 36,766 || 2.3% |
|||
|- |
|||
| [[London Borough of Croydon|Croydon, London]] || 29,745 || 7.6% |
|||
|- |
|||
| [[Manchester]] || 29,026 || 5.3% |
|||
|- |
|||
| [[Leeds]] || 27,388 || 3.4% |
|||
|- |
|||
| [[Hampshire]] || 26,198 || 1.9% |
|||
|- |
|||
| [[London Borough of Lambeth|Lambeth, London]] || 25,630 || 8.1% |
|||
|- |
|||
| [[London Borough of Lewisham|Lewisham, London]] || 24,253 || 8.1% |
|||
|- |
|||
| [[Oxfordshire]] || 22,611 || 3.1% |
|||
|- |
|||
| [[London Borough of Southwark|Southwark, London]] || 22,151 || 7.2% |
|||
|- |
|||
| [[Bristol]] || 21,116 || 4.5% |
|||
|- |
|||
| [[London Borough of Barnet|Barnet, London]] || 20,889 || 5.4% |
|||
|- |
|||
|} |
|||
==Subgroups== |
==Subgroups== |
||
In England and Wales, the 2001 census included four sub-categories of mixed ethnic combinations: "White and Black Caribbean", "Mixed White and Black African", "[[ |
In England and Wales, the 2001 census included four sub-categories of mixed ethnic combinations: "[[Mixed White and Black Caribbean (United Kingdom ethnicity category)|Mixed White and Black Caribbean]]", "[[Mixed White and Black African]]", "[[Mixed White and Asian (United Kingdom ethnicity category)|Mixed White and Asian]]" and "Any other Mixed background", with the latter allowing people to write in their ethnicity. Analysis of census results shows that, in England and Wales only, 237,000 people stated their ethnicity as Mixed White and Black Caribbean, 189,000 as Mixed White and Asian, 156,000 as Other Mixed, and 79,000 Mixed White and Black African.<ref>{{cite web|url=http://www.statistics.gov.uk/articles/nojournal/Mixed_ethnic_groups_pdf.pdf|title=Who are the 'Mixed' ethnic group?|publisher=Office for National Statistics|date=May 2006|first=Ben|last=Bradford|pages=4, 8|archive-url=https://webarchive.nationalarchives.gov.uk/ukgwa/20160105160709/http://www.ons.gov.uk/ons/rel/ethnicity/focus-on-ethnicity-and-identity/who-are-the--mixed--ethnic-group-/who-are-the--mixed--ethnic-group--article.pdf|archive-date=5 January 2016|url-status=dead}}</ref> |
||
The estimates for mid-2009 for England only suggest that there are 301,300 people in the Mixed White and Black Caribbean category, 127,500 Mixed White and Black African, 292,400 Mixed White and Asian, and 235,500 Other Mixed.<ref name=Estimates/> The White and Black African group grew fastest in percentage terms from 2001 to 2009, followed by White and Asian, Other Mixed and then White and Black Caribbean.<ref name=Estimates/> |
The estimates for mid-2009 for England only suggest that there are 301,300 people in the Mixed White and Black Caribbean category, 127,500 Mixed White and Black African, 292,400 Mixed White and Asian, and 235,500 Other Mixed.<ref name=Estimates/> The White and Black African group grew fastest in percentage terms from 2001 to 2009, followed by White and Asian, Other Mixed and then White and Black Caribbean.<ref name=Estimates/> |
||
The 2011 Census for England and Wales suggested that compared with 2001, the proportion of the population describing themselves as "White and Black Caribbean" rose from 0.5% to 0.8%, "White and Asian" from 0.4% to 0.6%, "White and Black African" from 0.2% to 0.3% and "Other Mixed" 0.3% to 0.5%.<ref>[http://www.ons.gov.uk/ons/dcp171776_290558.pdf Ethnicity and National Identity in England |
The 2011 Census for England and Wales suggested that compared with 2001, the proportion of the population describing themselves as "Mixed White and Black Caribbean" rose from 0.5% to 0.8%, "Mixed White and Asian" from 0.4% to 0.6%, "Mixed White and Black African" from 0.2% to 0.3% and "Other Mixed" 0.3% to 0.5%.<ref>[http://www.ons.gov.uk/ons/dcp171776_290558.pdf Ethnicity and National Identity in England and Wales 2011], Office for National Statistics, 11 December 2012</ref> |
||
and Wales 2011], Office for National Statistics, 11 December 2012</ref> |
|||
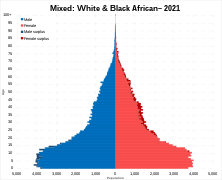
The census forms in [[Scotland]] and [[Northern Ireland]] did not include sub-groups, but rather single categories: "Any Mixed Background" in Scotland and simply "Mixed" in Northern Ireland.<ref name="Harmonised">{{cite web|url=http://www.statistics.gov.uk/about/data/harmonisation/downloads/P3.pdf|title=Harmonised Concepts and Questions for Social Data Sources: Primary Standards – Ethnic Group|date=April 2008|publisher=Office for National Statistics|url-status=dead|archive-url=https://web.archive.org/web/20100107095528/http://www.statistics.gov.uk/about/data/harmonisation/downloads/P3.pdf|archive-date=7 January 2010}}</ref><gallery mode="packed" caption="Population pyramids of each sub-category of the broader Mixed group in 2021"> |
|||
File:Mixed White and Black Caribbean population pyramid 2021.svg|Mixed White and Black Caribbean |
|||
File:Mixed White and Black African population pyramid 2021.svg|Mixed White and Black African |
|||
File:Mixed White and Asian population pyramid 2021.svg|Mixed White and Asian |
|||
File:Mixed Other population pyramid 2021.svg|Mixed Other |
|||
</gallery> |
|||
=== Detailed breakdown === |
|||
The census forms in [[Scotland]] and [[Northern Ireland]] did not include sub-groups, but rather single categories: "Any Mixed Background" in Scotland and simply "Mixed" in Northern Ireland.<ref name="Harmonised">{{cite web|url=http://www.statistics.gov.uk/about/data/harmonisation/downloads/P3.pdf|title=Harmonised Concepts and Questions for Social Data Sources: Primary Standards – Ethnic Group|date=April 2008|publisher=Office for National Statistics|url-status=dead|archive-url=https://web.archive.org/web/20100107095528/http://www.statistics.gov.uk/about/data/harmonisation/downloads/P3.pdf|archive-date=7 January 2010}}</ref> |
|||
{| class="wikitable sortable mw-collapsible mw-collapsed" |
|||
! rowspan="2" |Ethnic group within the Mixed group (in England and Wales) |
|||
! colspan="3" |2021<ref>{{Cite web |title=Ethnic group (detailed) - Office for National Statistics |url=https://www.ons.gov.uk/datasets/TS022/editions/2021/versions/1 |access-date=2023-01-25 |website=www.ons.gov.uk}}</ref> |
|||
|- |
|||
!Population |
|||
!% of total pop |
|||
!% of group makeup |
|||
|- |
|||
|Mixed or Multiple ethnic groups: White and Black Caribbean |
|||
|513,042 |
|||
|0.9 |
|||
|29.9% |
|||
|- |
|||
|Mixed or Multiple ethnic groups: White and Asian (unspecified) |
|||
|488,225 |
|||
|0.8 |
|||
|28.4% |
|||
|- |
|||
|Mixed or Multiple ethnic groups: White and Black African |
|||
|249,596 |
|||
|0.4 |
|||
|14.5% |
|||
|- |
|||
|Mixed or Multiple ethnic groups: Other Mixed |
|||
|107,957 |
|||
|0.2 |
|||
|6.3% |
|||
|- |
|||
|Mixed or Multiple ethnic groups: Any other ethnic group |
|||
|54,986 |
|||
|0.1 |
|||
|3.2% |
|||
|- |
|||
|Mixed or Multiple ethnic groups: Hispanic or Latin American |
|||
|28,064 |
|||
|0.0 |
|||
|1.6% |
|||
|- |
|||
|Mixed or Multiple ethnic groups: European Mixed, European unspecified, other European |
|||
|26,572 |
|||
|0.0 |
|||
|1.5% |
|||
|- |
|||
|Mixed or Multiple ethnic groups: Black and White (unspecified) |
|||
|18,164 |
|||
|0.0 |
|||
|1.1% |
|||
|- |
|||
|Mixed or Multiple ethnic groups: White and Arab |
|||
|16,359 |
|||
|0.0 |
|||
|1.0% |
|||
|- |
|||
|Mixed or Multiple ethnic groups: Black and Asian |
|||
|14,355 |
|||
|0.0 |
|||
|0.8% |
|||
|- |
|||
|Mixed or Multiple ethnic groups: White and North African or Middle Eastern |
|||
|12,904 |
|||
|0.0 |
|||
|0.8% |
|||
|- |
|||
|Mixed or Multiple ethnic groups: English/Welsh/Scottish/Northern Irish/British |
|||
|11,880 |
|||
|0.0 |
|||
|0.7% |
|||
|- |
|||
|Mixed or Multiple ethnic groups: Other White, White unspecified |
|||
|11,092 |
|||
|0.0 |
|||
|0.6% |
|||
|- |
|||
|Mixed or Multiple ethnic groups: Arab |
|||
|7,777 |
|||
|0.0 |
|||
|0.5% |
|||
|- |
|||
|Mixed or Multiple ethnic groups: Chinese and White |
|||
|7,642 |
|||
|0.0 |
|||
|0.4% |
|||
|- |
|||
|Mixed or Multiple ethnic groups: Caribbean |
|||
|7,579 |
|||
|0.0 |
|||
|0.4% |
|||
|- |
|||
|Mixed or Multiple ethnic groups: Caribbean Asian |
|||
|7,516 |
|||
|0.0 |
|||
|0.4% |
|||
|- |
|||
|Mixed or Multiple ethnic groups: Brazilian |
|||
|6,569 |
|||
|0.0 |
|||
|0.4% |
|||
|- |
|||
|Mixed or Multiple ethnic groups: Mixed White |
|||
|6,389 |
|||
|0.0 |
|||
|0.4% |
|||
|- |
|||
|Mixed or Multiple ethnic groups: South American |
|||
|5,989 |
|||
|0.0 |
|||
|0.3% |
|||
|- |
|||
|Mixed or Multiple ethnic groups: Mauritian/Seychellois/Maldivian/Sao Tomean/St Helenian |
|||
|5,741 |
|||
|0.0 |
|||
|0.3% |
|||
|- |
|||
|Mixed or Multiple ethnic groups: Iranian |
|||
|5,364 |
|||
|0.0 |
|||
|0.3% |
|||
|- |
|||
|Mixed or Multiple ethnic groups: Turkish |
|||
|5,149 |
|||
|0.0 |
|||
|0.3% |
|||
|- |
|||
|Mixed or Multiple ethnic groups: Mixed Black |
|||
|4,995 |
|||
|0.0 |
|||
|0.3% |
|||
|- |
|||
|Mixed or Multiple ethnic groups: Polynesian/Micronesian/Melanesian |
|||
|4,900 |
|||
|0.0 |
|||
|0.3% |
|||
|- |
|||
|Mixed or Multiple ethnic groups: Mixed Irish |
|||
|4,432 |
|||
|0.0 |
|||
|0.3% |
|||
|- |
|||
|Mixed or Multiple ethnic groups: African Asian |
|||
|4,071 |
|||
|0.0 |
|||
|0.2% |
|||
|- |
|||
|Mixed or Multiple ethnic groups: African unspecified |
|||
|3,925 |
|||
|0.0 |
|||
|0.2% |
|||
|- |
|||
|Mixed or Multiple ethnic groups: White and South Asian |
|||
|3,886 |
|||
|0.0 |
|||
|0.2% |
|||
|- |
|||
|Mixed or Multiple ethnic groups: English |
|||
|3,803 |
|||
|0.0 |
|||
|0.2% |
|||
|- |
|||
|Mixed or Multiple ethnic groups: Other Middle East |
|||
|3,647 |
|||
|0.0 |
|||
|0.2% |
|||
|- |
|||
|Mixed or Multiple ethnic groups: Indian or British Indian |
|||
|3,515 |
|||
|0.0 |
|||
|0.2% |
|||
|- |
|||
|Mixed or Multiple ethnic groups: European and Black African |
|||
|3,450 |
|||
|0.0 |
|||
|0.2% |
|||
|- |
|||
|Mixed or Multiple ethnic groups: White and East Asian |
|||
|3,111 |
|||
|0.0 |
|||
|0.2% |
|||
|- |
|||
|Mixed or Multiple ethnic groups: White Caribbean |
|||
|3,077 |
|||
|0.0 |
|||
|0.2% |
|||
|- |
|||
|Mixed or Multiple ethnic groups: European and North African or Middle Eastern |
|||
|3,003 |
|||
|0.0 |
|||
|0.2% |
|||
|- |
|||
|Mixed or Multiple ethnic groups: South Asian and European |
|||
|2,965 |
|||
|0.0 |
|||
|0.2% |
|||
|- |
|||
|Mixed or Multiple ethnic groups: Chinese |
|||
|2,871 |
|||
|0.0 |
|||
|0.2% |
|||
|- |
|||
|Mixed or Multiple ethnic groups: Other Asian, Asian unspecified |
|||
|2,849 |
|||
|0.0 |
|||
|0.2% |
|||
|- |
|||
|Mixed or Multiple ethnic groups: Asian (unspecified) and European |
|||
|2,805 |
|||
|0.0 |
|||
|0.2% |
|||
|- |
|||
|Mixed or Multiple ethnic groups: Mexican |
|||
|2,655 |
|||
|0.0 |
|||
|0.2% |
|||
|- |
|||
|Mixed or Multiple ethnic groups: Jewish |
|||
|2,595 |
|||
|0.0 |
|||
|0.2% |
|||
|- |
|||
|Mixed or Multiple ethnic groups: Portuguese |
|||
|2,508 |
|||
|0.0 |
|||
|0.1% |
|||
|- |
|||
|Mixed or Multiple ethnic groups: Anglo Indian |
|||
|2,473 |
|||
|0.0 |
|||
|0.1% |
|||
|- |
|||
|Mixed or Multiple ethnic groups: European and Black Caribbean |
|||
|2,266 |
|||
|0.0 |
|||
|0.1% |
|||
|- |
|||
|Mixed or Multiple ethnic groups: Italian |
|||
|2,248 |
|||
|0.0 |
|||
|0.1% |
|||
|- |
|||
|Mixed or Multiple ethnic groups: Black and European |
|||
|2,185 |
|||
|0.0 |
|||
|0.1% |
|||
|- |
|||
|Mixed or Multiple ethnic groups: Black British |
|||
|2,050 |
|||
|0.0 |
|||
|0.1% |
|||
|- |
|||
|Mixed or Multiple ethnic groups: White African |
|||
|2,017 |
|||
|0.0 |
|||
|0.1% |
|||
|- |
|||
|Mixed or Multiple ethnic groups: Mixed South Asian |
|||
|1,999 |
|||
|0.0 |
|||
|0.1% |
|||
|- |
|||
|Mixed or Multiple ethnic groups: Turkish Cypriot |
|||
|1,985 |
|||
|0.0 |
|||
|0.1% |
|||
|- |
|||
|Mixed or Multiple ethnic groups: Greek Cypriot |
|||
|1,968 |
|||
|0.0 |
|||
|0.1% |
|||
|- |
|||
|Mixed or Multiple ethnic groups: African/Arab |
|||
|1,924 |
|||
|0.0 |
|||
|0.1% |
|||
|- |
|||
|Mixed or Multiple ethnic groups: Chinese and other Asian |
|||
|1,907 |
|||
|0.0 |
|||
|0.1% |
|||
|- |
|||
|Mixed or Multiple ethnic groups: Moroccan |
|||
|1,879 |
|||
|0.0 |
|||
|0.1% |
|||
|- |
|||
|Mixed or Multiple ethnic groups: Spanish |
|||
|1,793 |
|||
|0.0 |
|||
|0.1% |
|||
|- |
|||
|Mixed or Multiple ethnic groups: Pakistani or British Pakistani |
|||
|1,691 |
|||
|0.0 |
|||
|0.1% |
|||
|- |
|||
|Mixed or Multiple ethnic groups: South African |
|||
|1,620 |
|||
|0.0 |
|||
|0.1% |
|||
|} |
|||
==See also== |
==See also== |
||
* [[Multiracial]] |
* [[Multiracial]] |
||
* [[Multiracial Americans]] |
* [[Multiracial Americans]] |
||
* [[Eurasian (mixed ancestry)]] |
|||
* [[Race of the future]] |
* [[Race of the future]] |
||
==References== |
==References== |
||
{{reflist}} |
{{reflist}} |
||
{{reflist|group=note}} |
|||
{{notelist}} |
|||
{{UK census ethnic groups}} |
{{UK census ethnic groups}} |
||
Latest revision as of 06:09, 19 June 2024
 Distribution by local authority in the 2011 census | |
| Total population | |
|---|---|
England and Wales by Mixed Ethnicities (2021) List
Northern Ireland: 14,382 – 0.8% (2021)[3] | |
| Regions with significant populations | |
| Religion | |
| Predominantly Irreligious (43.6%) or Christianity (36.7%); minority follows Islam (8.4%) and other faiths (3.0%)[a] 2021 census, NI, England and Wales only[4][5] |
Mixed is an ethnic group category that was first introduced by the United Kingdom's Office for National Statistics for the 2001 Census. Colloquially, it refers to British citizens or residents whose parents are of two or more races or ethnic backgrounds. The Mixed or Multiple ethnic group numbered just under 1.8 million in the 2021 United Kingdom census or 2.7% of the total UK population.[6][2][3]
Statistics[edit]
A number of academics have pointed out that the ethnicity classification employed in the census and other official statistics in the UK since 1991 involve confusion between the concepts of ethnicity and race.[7][8] Aspinall notes that sustained academic attention has been focused on "how the censuses measure ethnicity, especially the use of dimensions that many claim have little to do with ethnicity, such as skin colour, race, and nationality".[9]
The year 2001 was the first census which asked about mixed race identity. In that census, 677,177 classified themselves as of mixed ethnicity, making up 1.2 percent of the country's population.[10] The 2011 Census gave the figure as 2.2% for England and Wales.[11]
Office for National Statistics estimates suggest that 956,700 mixed-ethnicity people were resident in England (as opposed to the whole of the country) as of mid-2009, compared to 654,000 at mid-2001.[12] As of May 2011, this figure surpassed 1 million.[13] It was estimated in 2007 that, by 2020, 1.24 million people in the UK would be of mixed race.[14] Research conducted by the BBC, however, suggests that the mixed race population could already be twice the official estimate figure - up to 2 million.[15] According to The Economist in October 2020, the 2011 census figure "is probably an undercount, since not all children of mixed marriages will have ticked one of the mixed categories, and the number is likely to have grown since the census".[16]
3.5 percent of all births in England and Wales in 2005 were mixed-ethnicity babies, with 0.9 percent being 'Mixed White and Black Caribbean', 0.5 percent 'Mixed White and Black African', 0.8 percent 'Mixed White and Asian', and 1.3 percent any other mixed background.[17]
Population[edit]
| Region / Country | 2021[19] | 2011[23] | 2001[27] | |||
|---|---|---|---|---|---|---|
| Number | % | Number | % | Number | % | |
| 1,669,378 | 2.96% | 1,192,879 | 2.25% | 643,373 | 1.31% | |
| —Greater London | 505,775 | 5.75% | 405,279 | 4.96% | 226,111 | 3.15% |
| —South East | 260,871 | 2.81% | 167,764 | 1.94% | 85,779 | 1.07% |
| —East of England | 179,654 | 2.84% | 112,116 | 1.92% | 57,984 | 1.08% |
| —West Midlands | 178,224 | 2.99% | 131,714 | 2.35% | 73,225 | 1.39% |
| —North West | 163,245 | 2.20% | 110,891 | 1.57% | 62,539 | 0.93% |
| —East Midlands | 117,247 | 2.40% | 86,224 | 1.90% | 43,141 | 1.03% |
| —Yorkshire and the Humber | 117,017 | 2.14% | 84,558 | 1.60% | 44,995 | 0.91% |
| —South West | 114,074 | 2.00% | 71,884 | 1.36% | 37,371 | 0.76% |
| —North East | 33,271 | 1.26% | 22,449 | 0.86% | 12,228 | 0.49% |
| 60,899 | 1.12% | 19,815 | 0.37% | 12,764 | 0.25% | |
| 48,598 | 1.56% | 31,521 | 1.03% | 17,661 | 0.61% | |
| Northern Ireland | 14,382 | 0.76% | 6,014 | 0.33% | 3,319 | 0.20% |
| 1,793,257 | 2.68% | 1,250,414 | 1.98% | 677,117 | 1.15% | |


The 2021 United Kingdom census recorded a population of 1,793,257 or 2.7% of the population in the United Kingdom. When broken down by country, England recorded 1,669,378 (3.0%), Wales recorded 48,598 (1.6%)[1] and Northern Ireland recorded 14,382 (0.8%).[3] The equivalent census was recorded a year later in Scotland with a population of 60,899, or 1.1% of the population.[2] The ten local authorities with the largest proportion of those who identified as Mixed were all located in London: Lambeth (8.07%), Lewisham (8.07%), Croydon (7.61%), Islington (7.49%), Southwark (7.20%), Haringey (7.02%), Hackney (6.75%), Hammersmith and Fulham (6.73%), Kensington and Chelsea (6.64%) and Camden (6.63%). The three capitals of the other constituent countries of the United Kingdom held the highest proportion of the Mixed population in their respective countries with Cardiff at 4.00%, Edinburgh at 2.50%, and Belfast at 1.20%.[28]
Year of arrival (2021 census, England and Wales)[29]
| Upper tier local authority | Population | Percentage |
|---|---|---|
| Birmingham | 55,205 | 4.8% |
| Hertfordshire | 45,126 | 3.8% |
| Surrey | 40,483 | 3.4% |
| Essex | 36,774 | 2.4% |
| Kent | 36,766 | 2.3% |
| Croydon, London | 29,745 | 7.6% |
| Manchester | 29,026 | 5.3% |
| Leeds | 27,388 | 3.4% |
| Hampshire | 26,198 | 1.9% |
| Lambeth, London | 25,630 | 8.1% |
| Lewisham, London | 24,253 | 8.1% |
| Oxfordshire | 22,611 | 3.1% |
| Southwark, London | 22,151 | 7.2% |
| Bristol | 21,116 | 4.5% |
| Barnet, London | 20,889 | 5.4% |
Subgroups[edit]
In England and Wales, the 2001 census included four sub-categories of mixed ethnic combinations: "Mixed White and Black Caribbean", "Mixed White and Black African", "Mixed White and Asian" and "Any other Mixed background", with the latter allowing people to write in their ethnicity. Analysis of census results shows that, in England and Wales only, 237,000 people stated their ethnicity as Mixed White and Black Caribbean, 189,000 as Mixed White and Asian, 156,000 as Other Mixed, and 79,000 Mixed White and Black African.[32]
The estimates for mid-2009 for England only suggest that there are 301,300 people in the Mixed White and Black Caribbean category, 127,500 Mixed White and Black African, 292,400 Mixed White and Asian, and 235,500 Other Mixed.[12] The White and Black African group grew fastest in percentage terms from 2001 to 2009, followed by White and Asian, Other Mixed and then White and Black Caribbean.[12]
The 2011 Census for England and Wales suggested that compared with 2001, the proportion of the population describing themselves as "Mixed White and Black Caribbean" rose from 0.5% to 0.8%, "Mixed White and Asian" from 0.4% to 0.6%, "Mixed White and Black African" from 0.2% to 0.3% and "Other Mixed" 0.3% to 0.5%.[33]
The census forms in Scotland and Northern Ireland did not include sub-groups, but rather single categories: "Any Mixed Background" in Scotland and simply "Mixed" in Northern Ireland.[34]
- Population pyramids of each sub-category of the broader Mixed group in 2021
-
 Mixed White and Black Caribbean
 -
 Mixed White and Black African
 -
 Mixed White and Asian
 -
 Mixed Other


Detailed breakdown[edit]
| Ethnic group within the Mixed group (in England and Wales) | 2021[35] | ||
|---|---|---|---|
| Population | % of total pop | % of group makeup | |
| Mixed or Multiple ethnic groups: White and Black Caribbean | 513,042 | 0.9 | 29.9% |
| Mixed or Multiple ethnic groups: White and Asian (unspecified) | 488,225 | 0.8 | 28.4% |
| Mixed or Multiple ethnic groups: White and Black African | 249,596 | 0.4 | 14.5% |
| Mixed or Multiple ethnic groups: Other Mixed | 107,957 | 0.2 | 6.3% |
| Mixed or Multiple ethnic groups: Any other ethnic group | 54,986 | 0.1 | 3.2% |
| Mixed or Multiple ethnic groups: Hispanic or Latin American | 28,064 | 0.0 | 1.6% |
| Mixed or Multiple ethnic groups: European Mixed, European unspecified, other European | 26,572 | 0.0 | 1.5% |
| Mixed or Multiple ethnic groups: Black and White (unspecified) | 18,164 | 0.0 | 1.1% |
| Mixed or Multiple ethnic groups: White and Arab | 16,359 | 0.0 | 1.0% |
| Mixed or Multiple ethnic groups: Black and Asian | 14,355 | 0.0 | 0.8% |
| Mixed or Multiple ethnic groups: White and North African or Middle Eastern | 12,904 | 0.0 | 0.8% |
| Mixed or Multiple ethnic groups: English/Welsh/Scottish/Northern Irish/British | 11,880 | 0.0 | 0.7% |
| Mixed or Multiple ethnic groups: Other White, White unspecified | 11,092 | 0.0 | 0.6% |
| Mixed or Multiple ethnic groups: Arab | 7,777 | 0.0 | 0.5% |
| Mixed or Multiple ethnic groups: Chinese and White | 7,642 | 0.0 | 0.4% |
| Mixed or Multiple ethnic groups: Caribbean | 7,579 | 0.0 | 0.4% |
| Mixed or Multiple ethnic groups: Caribbean Asian | 7,516 | 0.0 | 0.4% |
| Mixed or Multiple ethnic groups: Brazilian | 6,569 | 0.0 | 0.4% |
| Mixed or Multiple ethnic groups: Mixed White | 6,389 | 0.0 | 0.4% |
| Mixed or Multiple ethnic groups: South American | 5,989 | 0.0 | 0.3% |
| Mixed or Multiple ethnic groups: Mauritian/Seychellois/Maldivian/Sao Tomean/St Helenian | 5,741 | 0.0 | 0.3% |
| Mixed or Multiple ethnic groups: Iranian | 5,364 | 0.0 | 0.3% |
| Mixed or Multiple ethnic groups: Turkish | 5,149 | 0.0 | 0.3% |
| Mixed or Multiple ethnic groups: Mixed Black | 4,995 | 0.0 | 0.3% |
| Mixed or Multiple ethnic groups: Polynesian/Micronesian/Melanesian | 4,900 | 0.0 | 0.3% |
| Mixed or Multiple ethnic groups: Mixed Irish | 4,432 | 0.0 | 0.3% |
| Mixed or Multiple ethnic groups: African Asian | 4,071 | 0.0 | 0.2% |
| Mixed or Multiple ethnic groups: African unspecified | 3,925 | 0.0 | 0.2% |
| Mixed or Multiple ethnic groups: White and South Asian | 3,886 | 0.0 | 0.2% |
| Mixed or Multiple ethnic groups: English | 3,803 | 0.0 | 0.2% |
| Mixed or Multiple ethnic groups: Other Middle East | 3,647 | 0.0 | 0.2% |
| Mixed or Multiple ethnic groups: Indian or British Indian | 3,515 | 0.0 | 0.2% |
| Mixed or Multiple ethnic groups: European and Black African | 3,450 | 0.0 | 0.2% |
| Mixed or Multiple ethnic groups: White and East Asian | 3,111 | 0.0 | 0.2% |
| Mixed or Multiple ethnic groups: White Caribbean | 3,077 | 0.0 | 0.2% |
| Mixed or Multiple ethnic groups: European and North African or Middle Eastern | 3,003 | 0.0 | 0.2% |
| Mixed or Multiple ethnic groups: South Asian and European | 2,965 | 0.0 | 0.2% |
| Mixed or Multiple ethnic groups: Chinese | 2,871 | 0.0 | 0.2% |
| Mixed or Multiple ethnic groups: Other Asian, Asian unspecified | 2,849 | 0.0 | 0.2% |
| Mixed or Multiple ethnic groups: Asian (unspecified) and European | 2,805 | 0.0 | 0.2% |
| Mixed or Multiple ethnic groups: Mexican | 2,655 | 0.0 | 0.2% |
| Mixed or Multiple ethnic groups: Jewish | 2,595 | 0.0 | 0.2% |
| Mixed or Multiple ethnic groups: Portuguese | 2,508 | 0.0 | 0.1% |
| Mixed or Multiple ethnic groups: Anglo Indian | 2,473 | 0.0 | 0.1% |
| Mixed or Multiple ethnic groups: European and Black Caribbean | 2,266 | 0.0 | 0.1% |
| Mixed or Multiple ethnic groups: Italian | 2,248 | 0.0 | 0.1% |
| Mixed or Multiple ethnic groups: Black and European | 2,185 | 0.0 | 0.1% |
| Mixed or Multiple ethnic groups: Black British | 2,050 | 0.0 | 0.1% |
| Mixed or Multiple ethnic groups: White African | 2,017 | 0.0 | 0.1% |
| Mixed or Multiple ethnic groups: Mixed South Asian | 1,999 | 0.0 | 0.1% |
| Mixed or Multiple ethnic groups: Turkish Cypriot | 1,985 | 0.0 | 0.1% |
| Mixed or Multiple ethnic groups: Greek Cypriot | 1,968 | 0.0 | 0.1% |
| Mixed or Multiple ethnic groups: African/Arab | 1,924 | 0.0 | 0.1% |
| Mixed or Multiple ethnic groups: Chinese and other Asian | 1,907 | 0.0 | 0.1% |
| Mixed or Multiple ethnic groups: Moroccan | 1,879 | 0.0 | 0.1% |
| Mixed or Multiple ethnic groups: Spanish | 1,793 | 0.0 | 0.1% |
| Mixed or Multiple ethnic groups: Pakistani or British Pakistani | 1,691 | 0.0 | 0.1% |
| Mixed or Multiple ethnic groups: South African | 1,620 | 0.0 | 0.1% |
See also[edit]
References[edit]
- ^ a b c "Ethnic group, England and Wales: Census 2021". Office for National Statistics. Retrieved 29 November 2022.
- ^ a b c d "Scotland's Census 2022 - Ethnic group, national identity, language and religion - Chart data". Scotland's Census. National Records of Scotland. 21 May 2024. Retrieved 21 May 2024. Alternative URL 'Search data by location' > 'All of Scotland' > 'Ethnic group, national identity, language and religion' > 'Ethnic Group'
- ^ a b c d "MS-B01: Ethnic group". Northern Ireland Statistics and Research Agency. 22 September 2022. Retrieved 7 January 2023.
- ^ United Kingdom census (2021). "DT-0036 - Ethnic group by religion". Northern Ireland Statistics and Research Agency. Retrieved 30 June 2023.
- ^ "RM031 Ethnic group by religion". Office for National Statistics. Retrieved 28 March 2023.
- ^ "Office for National Statistics (ONS), released 29 November 2022, ONS website, statistical bulletin, Ethnic group, England and Wales: Census 2021". Office for National Statistics. 29 November 2022. Retrieved 29 November 2022.
- ^ Ballard, Roger (1996). "Negotiating race and ethnicity: Exploring the implications of the 1991 census" (PDF). Patterns of Prejudice. 30 (3): 3–33. doi:10.1080/0031322X.1996.9970192.
- ^ Kertzer, David I.; Arel, Dominique (2002). "Censuses, identity formation, and the struggle for political power". In Kertzer, David I.; Arel, Dominique (eds.). Census and Identity: The Politics of Race, Ethnicity, and Language in National Censuses. Cambridge: Cambridge University Press. pp. 1–42.
- ^ Aspinall, Peter J (2012). "Answer Formats in British Census and Survey Ethnicity Questions: Does Open Response Better Capture 'Superdiversity'?". Sociology. 46 (2): 354–364. doi:10.1177/0038038511419195. S2CID 144841712.
- ^ "Population size: 7.9% from a minority ethnic group". Office for National Statistics. 13 February 2003.
- ^ ""Ethnicity Facts and Figures UK Government"". 22 December 2022.
- ^ a b c "Resident Population Estimates by Ethnic Group, All Persons June 2009". Office for National Statistics. Retrieved 28 August 2011.
- ^ Rogers, Simon (19 May 2011). "Non-white British population reaches 9.1 million". The Guardian. London.
- ^ Smith, Laura (23 January 2007). "Mixed messages". The Guardian. London.
- ^ "Mixed race UK population double official figure, says new report". BBC News. 6 October 2011.
- ^ "Britain's mixed-race population blurs the lines of identity politics". The Economist. 3 October 2020.
- ^ Moser, Kath; Stanfield, Kristina M.; Leon, David A. (2008). "Birthweight and gestational age by ethnic group, England and Wales 2005: Introducing new data on births" (PDF). Health Statistics Quarterly. 39 (39): 22–31. PMID 18810886. Archived from the original (PDF) on 15 February 2009.
- ^ "Ethnic group - England and Wales regions". Office for National Statistics. 29 November 2022. Retrieved 30 November 2022.
- ^ 2021/22: England and Wales,[18] Scotland,[2] and Northern Ireland[3]
- ^ "QS201EW: Ethnic Group". Nomis: Official Census and Labour Market Statistics. Retrieved 30 January 2013.
- ^ United Kingdom census (2011). "Table KS201SC - Ethnic group" (PDF). National Records of Scotland. Archived from the original (PDF) on 4 July 2018.
- ^ "Ethnic Group - Full Detail: QS201NI". Archived from the original on 23 October 2014. Retrieved 22 July 2014.
- ^ 2011: England and Wales,[20] Scotland,[21] and Northern Ireland[22]
- ^ "KS006: Ethnic group". Nomis: Official Census and Labour Market Statistics. Retrieved 30 June 2003.
- ^ "Analysis of Ethnicity in the 2001 Census - Summary Report". Retrieved 6 September 2014.
- ^ "Ethnic Group: KS06 (statistical geographies)". Archived from the original on 30 July 2014. Retrieved 22 July 2014.
- ^ 2001: England and Wales,[24] Scotland,[25] and Northern Ireland[26]
- ^ "Ethnic group - Office for National Statistics". www.ons.gov.uk. Retrieved 3 January 2023.
- ^ "Ethnic group and year of arrival in the uk - Office for National Statistics". www.ons.gov.uk. Retrieved 8 July 2023.
- ^ "TS021 - Ethnic group". Nomis: Official Census and Labour Market Statistics. Retrieved 30 March 2023.
- ^ "Scotland's Census 2022 - Ethnic group, national identity, language and religion - Chart data". Scotland's Census. National Records of Scotland. 21 May 2024. Retrieved 21 May 2024. Alternative URL 'Search data by location' > 'Local Authority (CA2019)' > 'Ethnic group, national identity, language and religion' > 'Ethnic Group'
- ^ Bradford, Ben (May 2006). "Who are the 'Mixed' ethnic group?" (PDF). Office for National Statistics. pp. 4, 8. Archived from the original (PDF) on 5 January 2016.
- ^ Ethnicity and National Identity in England and Wales 2011, Office for National Statistics, 11 December 2012
- ^ "Harmonised Concepts and Questions for Social Data Sources: Primary Standards – Ethnic Group" (PDF). Office for National Statistics. April 2008. Archived from the original (PDF) on 7 January 2010.
- ^ "Ethnic group (detailed) - Office for National Statistics". www.ons.gov.uk. Retrieved 25 January 2023.