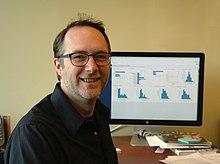
Jeffrey Heer
Jeffrey Michael Heer | |
|---|---|
 Heer in 2016 | |
| Born | June 15, 1979 |
| Alma mater | University of California, Berkeley (BS, MS, PhD) |
| Known for | Data visualization |
| Awards | TR35, Sloan Fellowship, ACM Grace Murray Hopper Award |
| Scientific career | |
| Fields | Computer science |
| Institutions | University of Washington, Stanford University |
| Doctoral advisor | Maneesh Agrawala |
| Doctoral students | |
| Website | homes |
Jeffrey Michael Heer (born June 15, 1979) is an American computer scientist best known for his work on information visualization and interactive data analysis. He is a professor of computer science & engineering[1] at the University of Washington, where he directs the UW Interactive Data Lab.[2] He co-founded Trifacta with Joe Hellerstein and Sean Kandel in 2012.
Education
[edit]Heer received a B.S., M.S. and PhD from the University of California, Berkeley.[3] As a graduate student at UC Berkeley, he developed the Prefuse and Flare[4] visualization toolkits.
Research and career
[edit]Heer was an assistant professor of computer science at Stanford University, from 2009 to 2013.[3] He is also co-founder and chief experience officer of Trifacta.[5] Heer's research focuses on new systems and techniques for data visualization. As a member of the Stanford University faculty, he worked with Mike Bostock on the Protovis and D3.js systems.
Heer then moved to the University of Washington where he worked with students and collaborators to develop the Vega and Vega-Lite visualisation grammars. Along with Joe Hellerstein and Sean Kandel, Heer has also developed interactive tools for data transformation (including Data Wrangler[6]), leading to the founding of Trifacta. Other research contributions include work on the graphical perception of visualizations, social data analysis, text visualization, and interactive language translation tools.
Awards and recognition
[edit]Heer's research has been recognized by an ACM Grace Murray Hopper Award,[7] a Gordon and Betty Moore Foundation Data-Driven Discovery Investigator Award,[8] an Alfred P. Sloan Fellowship,[9] and MIT Technology Review's TR35 list.[10] Heer and his students have won best paper awards at human-computer interaction[11][12] and visualization[13] conferences. His work has also appeared in the popular press.[14][15][16][17][18][19]
References
[edit]- ^ "Faculty - Computer Science & Engineering".
- ^ "UW Interactive Data Lab".
- ^ a b "Jeffrey Heer – Bio". washington.edu. Retrieved May 27, 2021.
- ^ "Data Visualization for the Web". Flare.
- ^ "Trifacta". Archived from the original on December 7, 2013.
- ^ Sean Kandel; Andreas Paepcke; Joseph Hellerstein; Jeffrey Heer. Wrangler: interactive visual specification of data transformation scripts. Proceedings of the SIGCHI Conference on Human Factors in Computing Systems. doi:10.1145/1978942.1979444.
- ^ "ACM Grace Murray Hopper Award 2016".
- ^ "Home - Gordon and Betty Moore Foundation". Archived from the original on March 15, 2016. Retrieved April 12, 2016.
- ^ "Alfred P. Sloan Research Fellowships 2012" (PDF). Alfred P. Sloan Foundation. Archived from the original (PDF) on May 9, 2016.
- ^ Review, MIT Technology. "Innovator Under 35: Jeffrey Heer, 30".
- ^ "Best of CHI - CHI 2013".
- ^ "UIST 2011 - 24th Symposium on User Interface Software and Technology (October 16-19, 2011 Santa Barbara, California)".
- ^ "EuroVis 2013 - The Eurographics Conference on Visualization".
- ^ "For Big-Data Scientists, 'Janitor Work' Is Key Hurdle to Insights". The New York Times. August 18, 2014.
- ^ Harris, Derrick (October 4, 2012). "Gigaom - Why Trifacta is teaching humans and data to work together".
- ^ Katherine Long (June 27, 2012). "UW recruits superstars of computer-science world". Seattle Times. Archived from the original on July 23, 2013.
- ^ "Love and marriage: How the UW is making bets on the brains of 'big data' and 'machine learning'". June 28, 2012.
- ^ "Show me". The Economist. February 27, 2010.
- ^ Greene, Kate. "Simpler Data Visualization".
