Pozo Almonte
Pozo Almonte | |
|---|---|
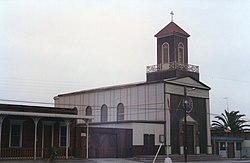
 Church of Pozo Almonte | |
| Coordinates (city): 20°16′S 69°48′W / 20.267°S 69.800°W | |
| Country | |
| Region | |
| Province | Tamarugal |
| Founded | 1875 |
| Government | |
| • Type | Municipal council |
| Area | |
| • Total | 13,765.8 km2 (5,315.0 sq mi) |
| Elevation | 1,072 m (3,517 ft) |
| Population (2017 Census)[1] | |
| • Total | 15,711 |
| • Density | 1.1/km2 (3.0/sq mi) |
| • Urban | 8,987 |
| • Rural | 6,724 |
| Demonym | Pocino |
| Sex | |
| • Men | 6,521 |
| • Women | 4,309 |
| Time zone | UTC−4 (CLT) |
| • Summer (DST) | UTC−3 (CLST) |
| Climate | BWk |
| Website | Official website (in Spanish) |
Pozo Almonte (Spanish pronunciation: [ˈposo alˈmonte]) is a city and commune of Chile located in the interior of Atacama Desert. It has been the capital of Tamarugal Province since this province was established in 2007. The city is located at 52 km (32 mi) from Tacapacá Region's capital, Iquique. It has over 15,000 inhabitants. The commune has an area of 13,766 km (8,554 mi) and borders the following communes: Iquique, Alto Hospicio, Huara, Pica, María Elena and Tocopilla (the last two being in Tocopilla Province).
Demographics
[edit]According to the 2017 census of the National Statistics Institute, Pozo Almonte had 15,711 inhabitants (8,987 men and 6,724 women). The population grew by 45% (4,881 persons) between the 2002 and 2017 censuses.[1]
Administration
[edit]As a commune, Pozo Almonte is a third-level administrative division of Chile administered by a municipal council, headed by an alcalde who is directly elected every four years.
Within the electoral divisions of Chile, Pozo Almonte is represented in the Chamber of Deputies by Marta Isasi (Ind.) and Hugo Gutiérrez (PC) as part of the 2nd electoral district, which includes the entire Tarapacá Region. The commune is represented in the Senate by José Miguel Insulza (PS, 2018–2026) and José Durana (UDI, 2018–2026) as part of the 1st senatorial constituency (Arica and Parinacota Region and Tarapacá Region).
Climate
[edit]| Climate data for Canchones, elevation 960 m (3,150 ft) | |||||||||||||
|---|---|---|---|---|---|---|---|---|---|---|---|---|---|
| Month | Jan | Feb | Mar | Apr | May | Jun | Jul | Aug | Sep | Oct | Nov | Dec | Year |
| Mean daily maximum °C (°F) | 31.8 (89.2) |
32.2 (90.0) |
32.0 (89.6) |
31.1 (88.0) |
29.9 (85.8) |
28.3 (82.9) |
29.0 (84.2) |
30.1 (86.2) |
31.3 (88.3) |
31.3 (88.3) |
31.8 (89.2) |
31.9 (89.4) |
30.9 (87.6) |
| Daily mean °C (°F) | 21.0 (69.8) |
21.0 (69.8) |
19.3 (66.7) |
17.0 (62.6) |
14.4 (57.9) |
12.9 (55.2) |
12.8 (55.0) |
13.4 (56.1) |
15.7 (60.3) |
16.4 (61.5) |
17.6 (63.7) |
19.2 (66.6) |
16.7 (62.1) |
| Mean daily minimum °C (°F) | 11.5 (52.7) |
11.3 (52.3) |
8.2 (46.8) |
5.4 (41.7) |
2.0 (35.6) |
0.0 (32.0) |
−0.2 (31.6) |
−0.5 (31.1) |
2.3 (36.1) |
3.2 (37.8) |
4.5 (40.1) |
7.0 (44.6) |
4.6 (40.2) |
| Average precipitation mm (inches) | 0.3 (0.01) |
0.3 (0.01) |
0.0 (0.0) |
0.0 (0.0) |
0.0 (0.0) |
0.0 (0.0) |
0.1 (0.00) |
0.0 (0.0) |
0.0 (0.0) |
0.0 (0.0) |
0.0 (0.0) |
0.0 (0.0) |
0.7 (0.02) |
| Average relative humidity (%) | 57 | 57 | 58 | 55 | 54 | 55 | 51 | 48 | 46 | 46 | 47 | 50 | 52 |
| Source: Bioclimatografia de Chile[2] | |||||||||||||
| Climate data for Colonia Pintados, elevation 977 m (3,205 ft) | |||||||||||||
|---|---|---|---|---|---|---|---|---|---|---|---|---|---|
| Month | Jan | Feb | Mar | Apr | May | Jun | Jul | Aug | Sep | Oct | Nov | Dec | Year |
| Mean daily maximum °C (°F) | 29.7 (85.5) |
30.3 (86.5) |
29.8 (85.6) |
29.2 (84.6) |
27.7 (81.9) |
26.6 (79.9) |
26.2 (79.2) |
28.7 (83.7) |
29.3 (84.7) |
28.1 (82.6) |
29.8 (85.6) |
29.5 (85.1) |
28.7 (83.7) |
| Daily mean °C (°F) | 19.8 (67.6) |
20.1 (68.2) |
18.1 (64.6) |
17.2 (63.0) |
15.0 (59.0) |
13.6 (56.5) |
13.6 (56.5) |
14.1 (57.4) |
15.7 (60.3) |
16.5 (61.7) |
17.4 (63.3) |
18.5 (65.3) |
16.6 (61.9) |
| Mean daily minimum °C (°F) | 11.1 (52.0) |
11.8 (53.2) |
9.7 (49.5) |
6.9 (44.4) |
3.9 (39.0) |
2.1 (35.8) |
1.8 (35.2) |
1.8 (35.2) |
4.0 (39.2) |
4.6 (40.3) |
5.4 (41.7) |
8.2 (46.8) |
5.9 (42.7) |
| Average precipitation mm (inches) | 0.0 (0.0) |
0.1 (0.00) |
0.0 (0.0) |
0.0 (0.0) |
0.0 (0.0) |
0.1 (0.00) |
0.0 (0.0) |
0.1 (0.00) |
0.0 (0.0) |
0.0 (0.0) |
0.0 (0.0) |
0.0 (0.0) |
0.3 (0) |
| Average relative humidity (%) | 60 | 61 | 60 | 60 | 61 | 56 | 52 | 59 | 59 | 58 | 55 | 61 | 59 |
| Source: Bioclimatografia de Chile[3] | |||||||||||||

References
[edit]- ^ a b c d "National Statistics Institute" (in Spanish). Retrieved 3 January 2019.
- ^ Hajek, Ernst; Castri, Francesco (1975). "Bioclimatografia de Chile" (PDF) (in Spanish). Archived from the original (PDF) on 22 November 2009. Retrieved 27 May 2024.
- ^ Hajek, Ernst; Castri, Francesco (1975). "Bioclimatografia de Chile" (PDF) (in Spanish). Archived from the original (PDF) on 22 November 2009. Retrieved 27 May 2024.
External links
[edit]- (in Spanish) Municipality of Pozo Almonte


