
Chapter 1: Atmospheric Basics
Alison Nugent
Learning Objectives
By the end of this chapter, you should be able to:
- Convert between temperature units of Fahrenheit, Celsius, and Kelvin
- Use mathematical formulas to define atmospheric temperature, pressure, and density
- Compute pressure and density changes with altitude
- Describe the vertical structure of Earth’s atmosphere
- Define and apply the ideal gas law
- Describe hydrostatic balance
- Discuss the difference between weather and climate
- Note the location of terminology, coordinate systems, and units for future reference
Introduction
We often take Earth’s atmosphere for granted. When we enjoy a sunset, go to the beach, or hike a trail, we don’t necessarily think of the vast volume of air around us that allows us to do these things. The atmosphere brings us the oxygen that fills our lungs; it brings us the beautiful blues of the sky above and the verdant greenery below. It is responsible for the existence of our oceans, lakes, and rivers, and without it we would not have beaches to enjoy. The fluffy, white cumulus clouds you see on a summer day are a result of both large- and small-scale motions in the atmosphere. The same is true of the hazy stratus, wispy cirrus, or towering cumulonimbus. The atmosphere is like a massive blanket that surrounds, sustains, protects, and warms us. Without it, no life would exist on Earth. In fact, the atmosphere is the very reason almost anything exists on Earth at all; our planet would be a dull, waterless, lifeless rock without it. Night-time without an atmosphere would be unimaginably cold, and daytime temperatures would soar above water’s boiling point. Nothing would separate Earth and the blistering sunlight but the empty vacuum of space.
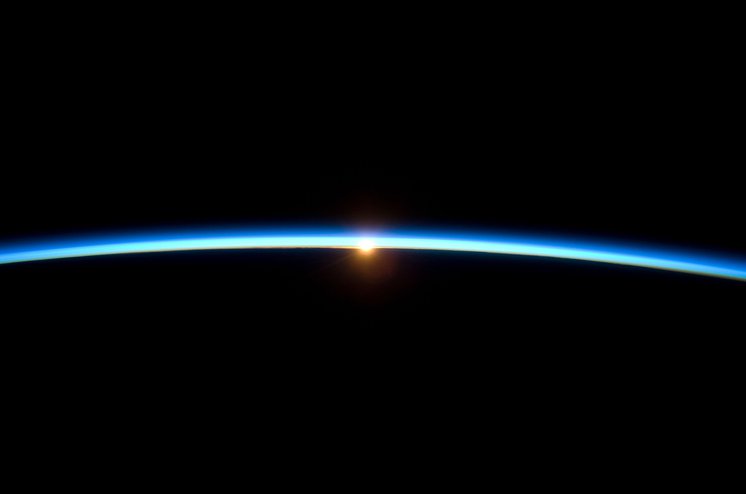
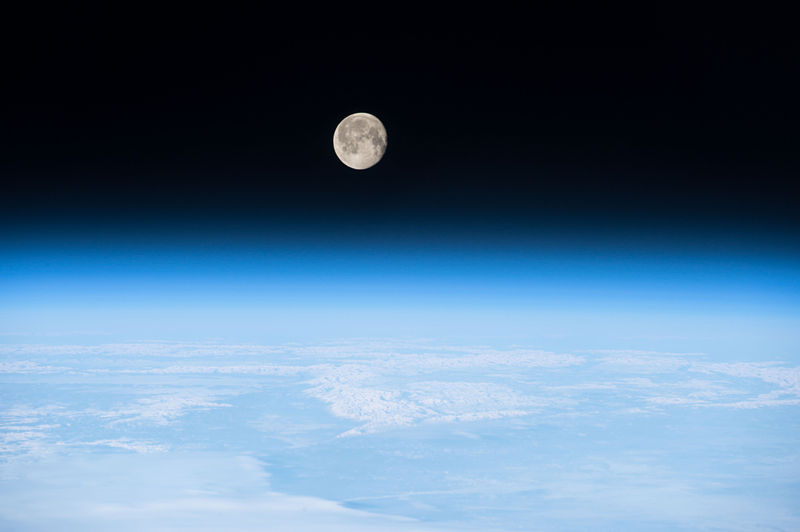
Although the atmosphere was previously described as “vast”, in actuality it is relatively thin. If the Earth were shrunk down to the size of a basketball, the atmosphere would be roughly the thickness of a plastic sheet stretched across the ball. In the image above, the atmosphere can be seen as the thin veil of bluish white mist above our planet’s surface. Although we can travel thousands of kilometers horizontally along Earth’s surface, traveling vertically would be difficult — the air is too thin to breathe only a few kilometers above Earth’s surface.
The goal of this chapter is to orient those who are new to atmospheric science with the basics as described previously in the Chapter 1 Learning Objectives.
Overview of Earth’s Atmosphere
Everything that happens on Earth is caused in some way by radiation from the sun, which is an average-sized star located near the edge of the Milky Way galaxy. It provides radiant energy (also called radiation or solar insolation) by converting hydrogen into helium near its core, which provides most of the Earth’s warmth. Here is a classic song about the Sun heating Earth.
The Earth only receives a tiny portion of the sun’s total energy output. It is this radiation that drives the atmosphere’s wind and weather patterns on the Earth’s surface. It is because of this solar input that the Earth can maintain an overall global average surface temperature of approximately 15°C (59°F).
Composition of the Atmosphere
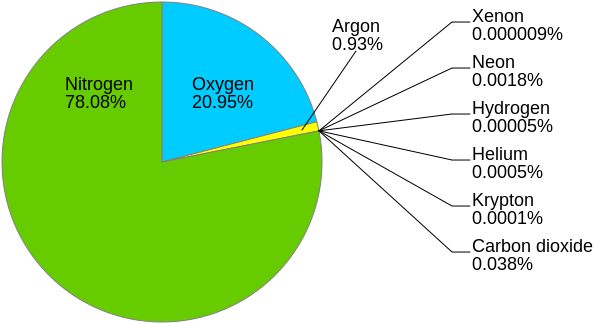
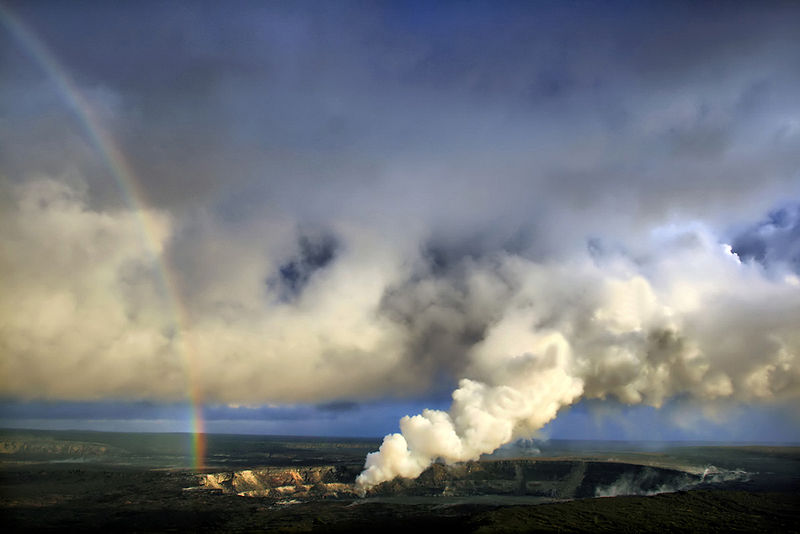
Earth’s atmosphere is primarily composed of nitrogen (N) and oxygen (O), with smaller quantities of other gases, as shown in the figure above. Nitrogen makes up around 78%, oxygen makes up around 21%, and Argon almost 1% of the total dry air volume in the atmosphere. Other gases (such as water vapor, the gaseous form of H2O) take up varying amounts depending on the location and atmospheric conditions. There is a balance of input and output of atmospheric gases at the Earth’s surface both from life and surface processes. For example, when we breathe, the human body takes in oxygen (O2) and releases carbon dioxide (CO2). When plants photosynthesize, they take in carbon dioxide and release oxygen. When water (H2O) evaporates from the ocean, additional water vapor (H2O) is added to the atmosphere. When the Kilauea volcano degasses, sulfur dioxide (SO2) is added to the atmosphere.
Water Vapor
Water vapor concentrations vary greatly from location to location, and from time to time. In warm, moist, tropical regions, water vapor can make up nearly 4% of the atmospheric composition, while in polar regions it can be just a tiny fraction of a percent. Water vapor cannot be seen in its gaseous form, but you may see it as it condenses into water droplets on the side of a cool glass of water on a hot day or into water droplets that make up clouds. The process of water vapor changing phase to liquid is called condensation. When liquid water becomes a gaseous vapor, it is known as evaporation. When water becomes ice or ice becomes water, these processes are known as freezing and melting, respectively. When ice transitions directly to water vapor, the process is known as sublimation. The transition from water vapor to ice is known as vapor deposition. These terms will all be used frequently in subsequent chapters.
Water vapor is one of the most important gases in our atmosphere, because when it changes phase from vapor to liquid or ice, it releases enormous amounts of heat, called latent heat. Latent heat is a major source of energy in the atmosphere, particularly for tropical storms and other types of convection. In addition, water vapor is an important greenhouse gas in the atmosphere, meaning it absorbs and re-releases a portion of the Earth’s outgoing radiation, which allows our planet to remain warm.
If you don’t understand convection, latent heat, and greenhouse gases yet, don’t worry, all will be discussed in later chapters. The point is that despite its small fractional percentage, water vapor is arguably the most important gas in the atmosphere.
Hawaiian Focus Box
The air composition of Hawaiʻi occasionally faces a unique threat due to the emissions from Kīlauea, a volcano located along the southern shore of Hawaiʻi’s Big Island. Kīlauea has been continuously erupting since 1983 and is the most active of the volcanoes that make up the Big Island. In the first few years after 1983, Kīlauea emitted up to 30,000 tons of sulfur dioxide (SO2) a day, but that number has stabilized recently to around 5,000 tons per day. At present day with the 2018 Kilauea eruptions currently occurring, SO2 emissions are again elevated. These emissions are known as volcanic smog, or more commonly, “vog”. The sulfate particles in vog are very small, so they can effectively infiltrate human airways. In environments with high relative humidity, such as inside the human body, these particles will hydrolyze and expand, which irritates lungs and obstructs airways. Vog has been linked to respiratory disease, sinusitus, and even lung cancer. Therefore, Hawaiʻi’s residents need to take precautions.
Vertical Structure of the Atmosphere
Although the atmosphere extends vertically for hundreds of kilometers, almost 99% of it is within approximately 30 km of the Earth’s surface. Air molecules are pulled toward Earth by the gravitational force, which pulls downward on the atmosphere. This causes the air molecules closer to Earth’s surface to be more tightly compressed, meaning that there are more air molecules together in a given volume (a higher density). The greater the number of air molecules that exist above a certain altitude, the greater the effect of this compression, because the molecules are all being pulled downward together. Just as gravity has an effect on the weight of different objects (weight is the force that acts on an object due to gravity), it also gives weight to air.


Mass is the measure of how much matter exists in a given object or space. Mass is occasionally confused with weight. While weight increases with more mass, mass would have no weight at all without the pull of gravity. Similarly, an object’s weight depends on the gravitational force: an object weighs much less on the moon than it does on Earth. Mass is typically given in grams (g) or kilograms (kg).
Air Density
Air density is determined by the amount of mass (m) that exists in a given space, or volume (V). If you fit a lot of mass into a tiny volume, you will have higher density. If you have only a small amount of mass spread out over a large volume, the density will be lower.


Putting these ideas together, air density is highest near the surface of Earth and decreases with height, because there are more molecules held tightly together at the surface by gravity than there are above. The standard unit for density is kg·m-3.
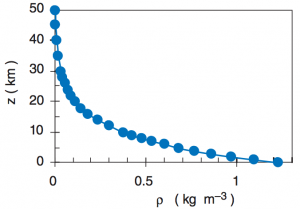
The image above shows the distribution of density (


where
“Scale height” is denoted by H and represents an e-folding distance for the drop off of density in the atmosphere. Typically the value of H is around 8000 m. This means that density at 8 km is approximately 1/e (e=2.71828) of the value at the surface. A back of the envelope calculation gives the density of the atmosphere at 8 km as 1.2 kg·m-3 divided by 3 and is approximately equal to 0.4 kg·m-3. Checking the image above, it is clear that this provides a relatively good estimate for density.
Air Pressure
You will often hear meteorologists on TV discuss the air pressure, or you might see H’s and L’s on a map displayed on the Weather Channel, denoting high and low pressure areas. Because air molecules are in constant motion, they collide with one another and other objects up to several billions of times a second. Each time an air molecule collides with an object, it exerts a tiny amount of force. Air pressure refers to the total force that air exerts against a given area of an object.


A Newton (N) is the unit for force and m2 is the unit for area, in the International System of Units (SI). Therefore, the standard unit for pressure is in Newtons per square meter — or Pascals (Pa), which are defined as 1 N·m-2.
Pro Tip: You will generally find air pressure expressed in units of millibars or (mb) or hectopascals (hPa) on weather maps. These two units are equivalent to one another. In the Practical Meteorology: An Algebra-based Survey of Atmospheric Science textbook by Roland Stull off of which this OER is based, kPa are often used. In the aviation field, Inches of mercury (inHg) are also commonly used. At sea level, the global average for atmospheric pressure is:
101.325 kPa = 1013.25 mb = 1013.25 hPa = 29.92 in. Hg. = 1 atm (atmosphere) = 101325 Pa.
In future calculations, you will usually need to express pressure in Pascals (Pa) for your units to cancel out. Always be mindful of the units you are given and be sure you are able to convert from one type of unit to another.
You can think of the surface air pressure as the total weight of a column of air molecules extending from the surface to the top of the atmosphere.
Because there are more air molecules at the surface of the Earth and less above, air pressure is maximized at the surface and decreases with height nearly exponentially, analogous to air density.
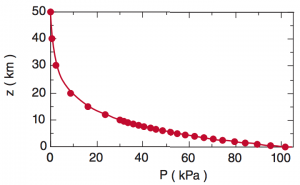
The image above shows the distribution of pressure (P) with altitude. Atmospheric surface pressure is typically around 1013 hPa. We call this value P0 because it is the initial value at the surface. The exponential equation below approximates the distribution of pressure with height

where P (Pa) is pressure, P0 (Pa) is the pressure at the Earth’s surface, z (m) is altitude, T (K) is temperature (assumed to be constant through the atmosphere), Rd = 287.053 J·K-1·kg-1 (gas constant for dry air), and g is the acceleration due to gravity (m·s–2).
You can get a sense of atmospheric pressure if you’ve ever dived more than a few feet underwater at the pool or beach. As you dive deeper, the weight of the water above you increases, and you feel increased discomfort or pressure on your head. This is why divers require special equipment to reach greater depths in the ocean. If you think of yourself at the bottom of an ocean of air, you can imagine why air pressure is highest down here at the surface. If you’ve ever flown on an airplane, you can also feel the changes in atmospheric pressure in your ears as you ascend and descend. Still, while pressure decreases at high elevations in an airplane, cabins are pressurized to maintain similar pressure to Earth’s surface so you are not experiencing the full pressure drop with altitude.
Air Temperature
It is commonly thought that air temperature is a measure of how cold or hot an object is. We instinctively know that the higher an object’s temperature, the hotter it will be, and the lower its temperature, the colder it will be. But what does temperature really measure? The answer lies in the motion of the molecules.
Air molecules are in constant motion, colliding with objects and one another. As we increase the temperature of a volume of air, the air molecules speed up, and collisions become more frequent. As we decrease the air temperature, the molecules slow down, and collisions occur less frequently. What is going on here? Simply put, air temperature is a relative measure of the average kinetic energy (kinetic meaning it relates to motion) of the molecules of a system.
Because there are more air molecules close to the Earth’s surface, density and air pressure are maximized at the surface and decrease with height. Based on this, do you think air temperature will decrease or increase as you move further away from the surface?
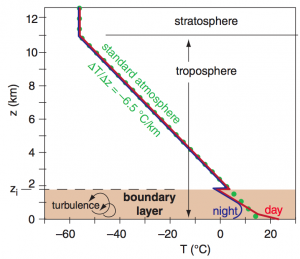
Within the lowest 10-12 km of the atmosphere, temperature tends to decrease with height, primarily because the Earth’s surface is warmed by sunlight, which then warms the layer of air directly above it, which warms the air above that, and so on. While this is true in the lowest surface layer of the atmosphere, this is not true throughout the rest of the atmosphere. The vertical temperature profile is more complicated than the vertical profile of pressure or density. Temperature is different for each of the different layers of the atmosphere, which will be discussed later.
Temperature Scales
Surface air temperature is commonly given in degrees Fahrenheit (°F) in the United States. If you were born and raised in the US, this is the temperature scale that you probably use in your daily life, and what you’ll see given when you look at the daily weather. You’ll know that 32°F is the temperature at which water freezes, and 212°F is the temperature at which water boils.
Degrees Celsius (°C) is also commonly used, especially internationally. Celsius is a convenient scale to use because water freezes at 0°C and boils at 100°C. A difference in 1°C is larger than a difference of 1°F by about 1.8 times. To convert between the two, use the following equations.


The Kelvin scale (K) is almost always used as a temperature unit in scientific equations and is convenient in that it contains no negative numbers. The Kelvin scale begins at 0 K, or absolute zero, where atoms and molecules would theoretically be thermally motionless. The Kelvin scale is also sometimes known as the absolute temperature scale. The lowest possible temperature is 0 K but it does not occur naturally. The coolest naturally existing place known in the universe is the Boomerang Nebula, located in the Centaurus constellation about 5,000 light-years away from Earth. The temperature is measured at 1 K, only 1°C above absolute zero. A difference in 1 K is the same as a difference of 1°C, so a conversion is linear and simple.

Based on this, absolute zero is -273.15 °C. Keep in mind degrees Celsius (°C) and degrees Fahrenheit (°F) always have the degree ° symbol in front, but Kelvin (K) never uses this symbol. Typical values of temperature on Earth’s surface on the Kelvin scale are values around 260-310 K.
Within atmospheric sciences, the Kelvin and Celsius scale are used. This chapter is one of the only times you’ll see a discussion of Fahrenheit within the course.
Equation of State — Ideal Gas Law
Air pressure is caused by the collisions of rapidly, randomly moving air molecules, so you might expect pressure to increase when there are more molecules in one place (higher density,
The gases in the atmosphere have a simple equation of state called the Ideal Gas Law.
For dry air (no water vapor present), the ideal gas law is

The ideal gas law assumes that atmospheric gases act in an ideal manner, meaning that there are few intermolecular forces, and that the size of the molecules is small compared to the space between them. In almost all cases, gases in the atmosphere can be assumed to be ideal gases. Again, this is another example of a simplifying assumption we use to be able to approximate relationships in the atmosphere.
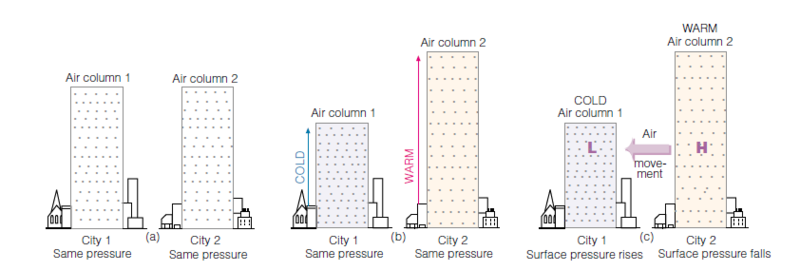
The above figure illustrates the effect that air temperature has on its density and pressure. The two air columns above Cities 1 and 2 in (a) have the same temperature, contain the same amount of mass, and have the same volume, so their density is the same. The pressure exerted on the surface is the same in both cities because the pressure at the surface is related to the number of air molecules above.
In (b) the air temperature above City 1 is lower than the air temperature above City 2. Because of this the air molecules in the column above City 1 are moving more slowly, and take up a smaller volume. Likewise, in City 2 the air molecules are moving more quickly and the volume in the column is larger. It only takes a smaller cold air volume to apply the same pressure on the surface as a larger warm air volume. The surface pressures are the same but the temperatures are not.
The surface pressure may be the same in (b) but the pressure aloft is not, which results in air movement that can be seen in (c). At the same altitude above Cities 1 and 2 in (c), there is more air above the same level in City 2 than in 1. Locally this creates a higher pressure aloft over the warmer City 2. Because of the difference in pressure aloft, airflow is created that moves from the higher pressure toward the lower pressure. This airflow caused by a localized difference in air pressure is what we call wind.
The movement of air from City 2 to City 1 creates a falling surface pressure in City 2 and a rising surface pressure in City 1.
Hydrostatic Balance
We’ve learned that atmospheric pressure decreases with height. We’ve also learned that air moves from areas of high pressure to areas of low pressure due to the pressure gradient force. Knowing these two things, you might think that the air in the atmosphere would escape into space, because there is high pressure at the surface and low pressure aloft. Because it does not, there must be a downward force that balances the upward vertical pressure gradient force. This downward force is a force that should be very familiar to you: gravity.
In the atmosphere, when the vertical pressure gradient force is balanced by gravity, this is known as hydrostatic balance. The word hydro means water or fluid, and static means stationary, so the name can be interpreted as a stationary fluid balance. This balance holds true for most situations in the atmosphere. The hydrostatic equation is given by

where g = -9.8 m·s-2 is the acceleration due to gravity.
The negative sign here is due to the fact that pressure is decreasing as height increases so the left-hand side will be negative.
If you plan to use the above equation to calculate changes in altitude (
Hypsometric Equation
You have learned that air pressure decreases with height, but sometimes we want to know the distance or thickness between two different pressure levels. The atmospheric thickness varies depending on the average temperature in the layer. Warmer air is spaced out more, so a warmer layer of air will be thicker, while a cooler layer of air will be thinner. By knowing the average temperature of the layer, and the top and bottom pressure levels, you can calculate the thickness of the atmospheric layer. The hypsometric equation allows you to calculate how pressure varies with height in an atmosphere regardless of the temperature profile. It is the result of combining the ideal gas law with the hydrostatic equation. The hypsometric equation allows you to calculate the thickness ( z2 – z1 ) between two pressure levels, P2 and P1. The z2 and z1 values are the heights at pressure levels P2 and P1, respectively.


In the above equation, the average temperature is shown. If the atmosphere is very moist, you may wish to use the average virtual temperature between the two heights z2 and z1 instead which includes the effects of water vapor.
Tv is known as the virtual temperature, defined as:
![\begin{align*} T_v = T * [1 + (0.61 * r) ] \end{align*}](https://pressbooks-dev.oer.hawaii.edu/atmo/wp-content/ql-cache/quicklatex.com-629c4a7c2b21fe76c9de891153f046e9_l3.png "Rendered by QuickLaTeX.com")
where the mixing ratio (r) is the mass of water vapor per mass of dry air and uses units of kilograms of water vapor per kilograms of dry air (kg·kg-1). You will learn that many times virtual temperature can be used inside of equations in place of temperature if the effect of water vapor needs to be included.
Layers of the Atmosphere
In the previous sections, we talked about how both air pressure and density decrease with height, because most of the atmosphere is held close to the Earth’s surface. This change in pressure and density occurs quickly at first, but slows down at higher altitudes. Unfortunately the change in temperature with altitude is not nearly as straightforward. When we look at a vertical profile of the atmosphere, we see that it can be divided into different layers in a number of ways. We can define layers by how the air temperature varies with height, by the gas composition, and even by the electrical properties of each layer.
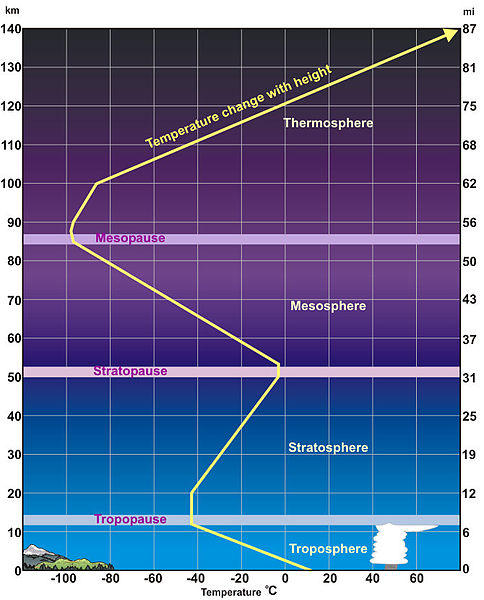
As can be seen in the above figure, the air temperature decreases with height up to the tropopause, 11 km in this example. This occurs because radiation from the sun warms the Earth’s surface, and the surface warms the air just above it. This will be discussed in further detail in later chapters.
Troposphere
The layer of the atmosphere that we are most familiar with is the troposphere, which extends from the surface to around 11 km. All of the every day weather that we experience on Earth happens within the troposphere, which is characterized by frequent rising and sinking vertical air motions. The troposphere gets its name from the root word “tropo” in Greek, which means turning.
At the top of the troposphere, the air temperature stops decreasing with height in a region known as the tropopause, which separates the troposphere and the stratosphere above. The height of the tropopause varies depending on the season and location. In warmer areas near the equator, the tropopause tends to be higher (around 17 km), while in colder polar regions the tropopause is lower (around 9 km) because warm layers of air are thicker than layers of cold air. For the same reason, the tropopause is found at higher elevations in the summer, and at lower elevations in the winter. Aircraft fly at the tropopause height.
Atmospheric Boundary Layer
The atmospheric boundary layer (ABL) is located within the lowest 0.3 to 3 km of the troposphere and is affected in several ways due to its close proximity with the Earth’s surface. Airflow closest to the surface slows down due to the effect of friction, which can be amplified due to the type of terrain or amount of vegetation. Because of this, the boundary layer experiences the greatest amount of turbulence in the atmosphere. In addition, the boundary layer is warmed by the Earth’s surface during the daytime, so it is the layer that is most affected by the diurnal (day-night) heating cycle.
Stratosphere
In the stratosphere, the air temperature increases with height, causing a temperature inversion. This inversion layer tends to keep rising and sinking tropospheric air from mixing with stratospheric air. It also prevents rising and sinking from happening in the stratosphere itself. Because of this, it is called a stratified layer. The root word “strato” means layered, or spreading out, which is a good way to describe the many layers of the stratosphere. The temperature of the stratosphere increases with height because of the presence of a gas called ozone (O3), which heats the air through the absorption of ultraviolet (UV) radiation from the sun.
At around 50 km, where the stratosphere is warmest (due to most of the UV radiation absorption occurring in the uppermost parts of the layer). The boundary known as the stratopause separates the stratosphere below from the mesosphere above.
Mesosphere
In the mesosphere, the air temperature once again decreases with height and the air is extremely thin with a low density. The average atmospheric pressure in this layer is about 1 mb, which means that about 99.9% of all air molecules are located below this level and only about one thousandth of the atmospheric mass is located above. You would not survive very long in the mesosphere, however, due to the extreme thinness of the air, freezing temperatures, and direct exposure to ultraviolet radiation. In addition, your blood would begin to boil at normal body temperatures if it were directly exposed to the low air pressure. The reason that temperatures decrease with height in the mesosphere is due partially to the fact that there is not a lot of ozone to absorb UV radiation. Because of this, the air molecules in the mesosphere lose more energy than they absorb.
At about 85 km near the mesopause, the atmosphere is at its coldest at about -90°C. The mesopause separates the mesosphere from the thermosphere above.
Thermosphere
In the thermosphere, the air density is extremely low so even a small amount of radiation absorption can lead to a large increase in temperature. Molecules can travel for entire kilometers without colliding into another molecule. This is the layer where auroras occur as a result of interactions between charged solar particles and air molecules.
At the top of the thermosphere, at above 500 km above the Earth’s surface, molecules can actually escape the gravitational pull of the Earth. This region is known as the exosphere, and represents the upper limit of the atmosphere.
The previous figure shows the levels in Earth’s atmosphere and the phenomena and activities that occur there. For example, commercial jet airplanes fly at the base of the stratosphere, while the International Space Station is positioned in the thermosphere.
Chapter 1 contained a vast array of topics, from defining temperature and pressure, to describing atmospheric vertical structure and components. As a reminder, these were our learning goals:
- Convert between temperature units of Fahrenheit, Celsius, and Kelvin
- Use mathematical formulas to define atmospheric temperature, pressure, and density
- Compute pressure and density changes with altitude
- Describe the vertical structure of Earth’s atmosphere
- Define and apply the ideal gas law
- Describe hydrostatic balance
- Discuss the difference between weather and climate
- Note the location of terminology, coordinate systems, and units for future reference
The next section will discuss weather vs. climate and various terms and coordinate systems that are useful to review.
Weather and Climate: What’s the Difference?
Occasionally the terms “weather” and “climate” get confused with one another. Climate change has been a hot topic in recent decades. Knowing this, you might conclude that when the climate changes — it must be a pretty big deal, however, the weather is in a constant state of change. If it weren’t, we would have little need to check the Internet or local weather station to see what the sky is going to look like tomorrow. Nobody bats an eye when the weather is different from one day to the next. What do we mean exactly by the terms weather and climate?
Weather refers to the present condition of the atmosphere at any given time and place. This includes the following elements.
Air Temperature — how hot or cold the air is.
Air Pressure — the force the air exerts on the surface.
Humidity — the amount of water vapor present in the air.
Clouds — masses of water droplets and/or ice crystals that obscure parts of the sky.
Precipitation — water (solid or liquid) that falls from clouds and reaches the ground
Visibility — the maximum horizontal distance that can be seen. This can be affected by the presence of fog or precipitation.
Wind — the horizontal flow of air, caused by local differences in air pressure.
Climate represents the average range of weather events in a region over a long period of time including weather extremes such as heat waves or cold spells, as well as the frequency of these events.
One way to think of it is weather influences the kind of clothing we might wear that day, e.g., Will I need a raincoat? Is it too warm to wear long sleeves? Is it too cool to wear shorts? Climate, on the other hand, influences what clothing we buy. For example, in Hawaiʻi, it isn’t likely that you would need to buy a heavy winter jacket.
Chapter 1 Reference Guide: Coordinate Systems, Units, Terminology
This reference guide covers some topics that are outlined in Roland Stull’s Practical Meteorology: An Algebra-based Survey of Atmospheric Science Chapter 1, which may be useful to you going forward. These topics include the following.
Meteorological Conventions:
This section describes standard meteorological conventions that are necessary to keep in mind when solving problems in this course. It includes different coordinate systems, including Cartesian coordinates, polar coordinates, and spherical coordinates. You are likely already well acquainted with Cartesian coordinates, but polar and spherical coordinates may be new to you. The standard way of describing and plotting wind direction is also given here.
Cartesian coordinates: x, y, and z and velocity: u, v, and w.
Polar coordinates: direction and magnitude.
Wind in Cartesian coordinates: (U, V)
Wind in Polar coordinates: (
Algebraically, wind is given a magnitude (wind speed) and a direction. Wind direction is split up into different components. When only horizontal wind motion is taken into account, we use U and V, and vertical air motions are denoted by W.
U -> Wind in the x-direction
V -> Wind in the y-direction
W -> Wind in the z-direction (vertical air motion)
Because of this, wind can be plotted using polar coordinates, wind direction (dir) and wind magnitude (spd).
Wind directions are given by angle, with 0° to the north, and degrees increasing clockwise. Winds are described using the direction from which they come. A westerly wind is a wind from the west. Hawaiʻi is often impacted by the easterly or northeasterly trade winds, which come from the east and northeast.


Sometimes, cylindrical coordinates (M,
The Stull text uses the words “ordinate” and “abscissa”. Ordinate is simply the vertical axis (typically the y-axis) and abscissa is the horizontal axis (typically the x-axis). Independent variables are usually plotted on the x-axis, with dependent variables plotted on the y-axis.
Earth Frameworks Reviewed:
The Earth is not a sphere, but it is pretty close. The distance between the center of the Earth and the north and south poles differs by about 20 km, so the Earth is referred to as an oblate spheroid.
Cartography:
Meridians, which are north-south lines on a globe, are given by degrees longitude. Think of the distance between the north and south poles as long.
The prime meridian lies at 0° longitude, and passes through Greenwich, Great Britain.
East of here (defined as the Eastern Hemisphere, 0 – 180 °E), longitude is positive.
West of the prime meridian (Western Hemisphere, 0 – 180 °W), longitude is negative.
The Earth rotates counterclockwise about its axis.
Parallels, which are east-west lines on a globe, are given by degrees latitude. A good way to remember this is “Lat” rhymes with “flat” — just like the east-west horizontal (flat) lines of latitude.
The Equator is 0° latitude, with latitudes north of the Equator as positive (Northern Hemisphere: 0 – 90°N), and latitudes south of the Equator are negative (Southern Hemisphere: 0 – -90°S).
A helpful approximation between degrees of latitude and distance is that each degree of latitude is approximately 111 km, or about 60 nautical miles.
Chapter 1: Questions to Consider
- Drag and drop the correct labels to the appropriate layers of the atmosphere.
- Mauna Kea on Hawaiʻi Island is 13,803 feet tall at the summit. If the pressure at sea level is 1015 hPa and the scale height is 8 km, what is the pressure at the summit? (Hint: don’t forget to check the units!)
- The pressure at the ground floor of a high-rise building is 1012 hPa. On the roof the pressure is 1007 hPa. If you assume that the air density is 1.2 kg·m-3 and acceleration due to gravity is -9.8 m·s-2, approximately how tall is the building?
- In this chapter you learned about two different equations that describe the change in air pressure (P) with altitude (z):


When is the exponential equation preferable? When is the hydrostatic equation preferable? In questions two and three above, which equation did you use, and would your answers change if you used the other instead? Think about the assumptions that go into each equation and which variables are assumed to remain constant while pressure varies.
Selected Practice Question Answers: