Egypt - Foreign trade
Before 1973, when Egypt was linked to the then-Soviet Union, 55% of its exports went to Soviet bloc countries, which supplied 30% of its imports. In 1999, the EU countries were the market for about 35% of Egypt's exports, and provided Egypt with 36% of its imports. The US provided some 14% of Egypt's imports and received over 12% of its exports. Trade with Libya and Saudi Arabia has increased in recent years. Petroleum replaced cotton and cotton products as Egypt's principal export in 1976. Fuel exports accounted for 37% of Egypt's estimated $3.5 billion in merchandise exports in 1999. Other exports include textile yarn and cotton (7%), fabric, and finished garments (7.9%). In 1999, Egypt's imports were distributed among the following categories:
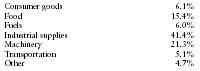
| Consumer goods | 6.1% |
| Food | 15.4% |
| Fuels | 6.0% |
| Industrial supplies | 41.4% |
| Machinery | 21.3% |
| Transportation | 5.1% |
| Other | 4.7% |
Principal trading partners in 1999 (in millions of US dollars) were as follows:
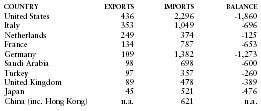
| COUNTRY | EXPORTS | IMPORTS | BALANCE |
| United States | 436 | 2,296 | -1,860 |
| Italy | 353 | 1,049 | -696 |
| Netherlands | 249 | 374 | -125 |
| France | 134 | 787 | -653 |
| Germany | 109 | 1,382 | -1,273 |
| Saudi Arabia | 98 | 698 | -600 |
| Turkey | 97 | 357 | -260 |
| United Kingdom | 89 | 478 | -389 |
| Japan | 45 | 521 | -476 |
| China (inc. Hong Kong) | n.a. | 621 | n.a. |
My class is now using it
This is the best website I have ever knowned
I cAN GET A+ EVERY TIME I HAD A PROJECT
LOVE IT