Improve hybrid cloud performance with instant visibility and real-time alerts.
USE CASE
OpenTelemetry and Splunk
Capture, generate and export telemetry data into observability tools for comprehensive software performance and behavior analysis.

HOW WE HELP

Built-in standard for observability
From distribution of the OpenTelemetry Collector, OpenTelemetry Java, Node.JS, .NET and Python client libraries, and instrumentation packages or SDKs from hundreds of commonly used frameworks, Splunk supports automatic trace instrumentation and configuration to make it easy to get started. Plus, you can customize what's included by building from the community source.
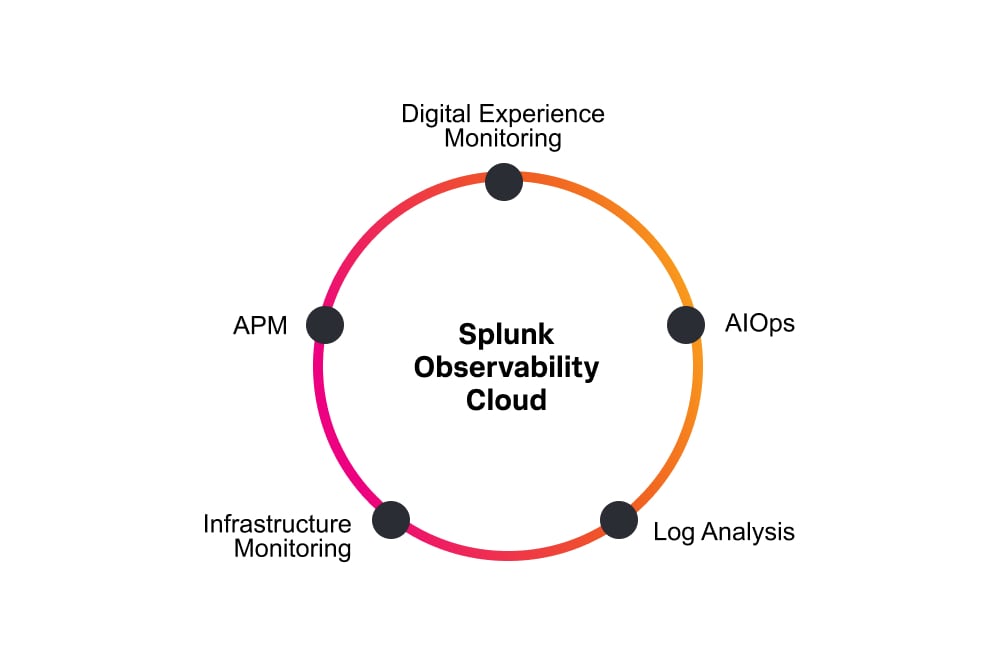
Powering end-to-end observability
View the status, interactions, dashboards and logs from all of your infrastructure in Splunk Observability Cloud or other observability tools. You can use OpenTelemetry to capture traces, metrics and logs from OpenTelemetry SDKs on the same host or over the networks, or from hundreds of sources, including databases, network proxies, Prometheus and Jaeger and more.
Improve performance
Maintain vendor neutrality and optimize performance of revenue-generating applications by addressing failure conditions.
Centralize your data
Capture data from all sources with a single agent using the OpenTelemetry Collector — without sacrificing choice. Use open standards and easy instrumentation.
Integrate with ease
Use an array of languages, frameworks and libraries to manage all your integrations.
Troubleshoot faster
Tackle performance issues quickly and reduce mean time to resolution (MTTR) with context-aware workflows powered by metrics, traces and logs.
Splunk Advantage
Supported by Splunk
Splunk offers a preconfigured and fully supported distribution of the OpenTelemetry Collector; which supports automatic (no code modification) trace instrumentation and comes with default configuration and out-of-the-box support for Splunk Application Performance Monitoring and Splunk Infrastructure Monitoring — making it easier than ever to get started.
Easy to get started
Unlike other vendors that “support OpenTelemetry” but still encourage you to use their proprietary agents, we are OpenTelemetry-native. We have built Splunk Observability on top of OpenTelemetry, so no matter your instrumentation or data collection agent, you can pull in your data with ease.
Splunk distribution of OpenTelemetry Collector
The Splunk OpenTelemetry Collector Distribution supports automatic (no code modification) trace instrumentation and comes with default configuration and out-of-the-box support for Splunk Application Performance Monitoring and Splunk Infrastructure Monitoring — making it easier than ever to get started.
Top contributor to the OpenTelemetry project
Splunk is committed to the advancement of the OpenTelemetry project. We have a team of 20+ engineers on a dedicated OpenTelemetry team that has made over 100,000 contributions and counting. Get involved in the conversation on the CNCF Slack or join a special interest group.

CUSTOMER STORY
Care.com Refactors Monoliths Into Microservices With Splunk Observability
We could bake OpenTelemetry into our architecture from day one because we have Splunk, who is the number-one contributor to OpenTelemetry and way ahead of the curve on this.